


Measuring What Matters—A Simple Introduction to OEE
Ever have one of those days on the factory floor? The kind where everything feels like it’s moving, the lights are on, the noise is right, but at the end of the shift, the numbers just don’t add up. You’ve produced less than you’d planned, and you’re not entirely sure why. Was it that little stoppage on Line 2? Did the changeover on the CNC machine take longer than usual? Or was there a bad batch that had to be scrapped? It feels like you’re playing whack-a-mole with problems, fixing one thing just as another pops up.
To be honest, that’s the reality for a lot of manufacturers. We’re swimming in data yet starved for wisdom. We have spreadsheets, dashboards, and daily reports, but they often create more noise than clarity. The challenge isn’t a lack of information; it’s the lack of a simple, actionable metric that tells you the real story of what’s happening with your equipment.
This is where Overall Equipment Effectiveness, or OEE, comes in. It’s not some overly complex system that requires a team of consultants to implement. Think of it as a powerful lens—a single, elegant percentage that cuts through the noise and shows you exactly where you are losing productivity. It’s a tool that helps you stop guessing and start making targeted, impactful improvements. If you’re ready to understand your production floor in a way you never have before, let’s talk about OEE.
What is OEE?
Let’s get straight to it. Overall Equipment Effectiveness is a metric that measures how well a manufacturing operation is utilised. In simple terms, it tells you what percentage of your planned production time is truly productive. A perfect OEE score of 100% means you are manufacturing only good parts, as fast as possible, with no stop time.
Of course, nobody gets 100%. That’s not the point. The point of OEE is to give you a comprehensive picture of your machine’s health and performance.
Why does this one metric matter so much? Because in manufacturing, problems are rarely isolated. A machine that runs slow might also be producing more defects. A machine that breaks down frequently isn’t running at all, let alone at speed. Before OEE, teams would often argue about the “real” problem. The maintenance team might blame operators for running the machine too hard, while the production team blames maintenance for lengthy repairs. Quality might point fingers at both. Sound familiar?
OEE ends these debates. It combines the three most critical factors of production into a single number. It rolls up Availability (is the machine running?), Performance (is it running as fast as it should?), and Quality (is it making good parts?) into one clear score. By doing this, it forces everyone to look at the same picture. It simplifies the complexity of the factory floor into a universal language that everyone from the operator to the managing director can understand. It’s not about blame; it’s about a shared understanding of reality. And from that shared reality, real improvement can begin.
Breaking Down the OEE Components
OEE’s power comes from its three core components. Understanding each one individually is the key to understanding your overall score and, more importantly, knowing where to focus your improvement efforts.
Availability: Are We Running?
Availability answers the simple question: When we were scheduled to be running, were we actually running? It accounts for any time the machine should be producing but isn’t. This is what we call downtime.
Downtime comes in two main flavours. There’s planned downtime, which is part of the normal schedule—things like planned maintenance, team briefings, or scheduled tea breaks. These are necessary and are usually excluded from the OEE calculation because you never intended to produce during that time.
Then there’s the killer: unplanned downtime. This is the stuff that wrecks your day and your production targets. It’s the unexpected breakdown, the tool change that takes twice as long as it should, the material shortage that leaves a machine sitting idle. I remember standing by a packaging machine once, watching it sit silent for forty minutes because we’d run out of the right size of cardboard boxes. That’s lost availability. Every minute of unplanned downtime is a minute of potential production you will never get back.
To improve availability, you need to ruthlessly track and attack these unplanned stops. Are your changeovers slow? Time them, analyse them, and create a standard process. Are you suffering from frequent breakdowns? It might be time to look at a preventative maintenance schedule. Is it material starvation? That’s a signal to look upstream at your supply chain or internal logistics.
Performance: Are We Running Fast Enough?
So, the machine is running. Great. But is it running as fast as it’s capable of? That’s what the Performance component measures. It accounts for any factors that cause the machine to run at less than its maximum possible speed, which we often call the ideal cycle time.
Performance losses can be a bit trickier to spot than a full-on breakdown. They are often the “death by a thousand cuts” of manufacturing. This includes things like minor stops, where the machine halts for a few seconds to clear a jam or an operator makes a small adjustment. One or two of these don’t seem like a big deal, but when they happen hundreds of times a day, the lost time is staggering. I once worked with a bottling line where a sensor would occasionally misread a bottle cap, pausing the line for two seconds. It happened so often the operators just accepted it as “how the machine runs.” Once we started tracking it, we realised it was costing us nearly an hour of production every single day.
Performance loss also includes reduced speed, where the machine is intentionally run slower than its designed rate. Maybe it’s because the raw material isn’t quite right, or because operators are trying to prevent jams and defects. Whatever the reason, you’re not getting the full throughput the asset is capable of. Identifying these speed losses is the first step to understanding why they are happening and how you can get back to your ideal run rate.
Quality: Are We Making Good Parts?
Finally, we get to Quality. You can be running all day (great Availability) at top speed (great Performance), but if half of what you’re producing has to be thrown in the skip, what was the point? The Quality component measures the proportion of good parts you produce compared to the total number of parts you started.
This is often tracked as First Pass Yield, which is a fancy way of saying “parts that were made right the first time without needing any rework.” Every part that is scrapped, rejected, or sent for rework represents a massive waste. You’ve already spent the money on the raw materials, the machine time, the energy, and the labour. Creating a defective part isn’t just a loss of that unit; it’s a loss of all the resources that went into it.
The impact of poor quality goes beyond the factory walls. It affects customer satisfaction, brand reputation, and can lead to costly returns. Improving quality often involves looking at your process control. Are your machine settings correct? Are your operators properly trained? Is the quality of your raw material consistent? By tracking your quality rate as part of OEE, you shine a bright light on the true cost of defects and create a powerful incentive to get it right the first time, every time.
How Is OEE Calculated?
Now for the math bit. Don’t worry, it’s refreshingly simple. The formula is:
OEE = Availability x Performance x Quality
Each component is expressed as a percentage, and you multiply them together to get your final OEE score. Let’s walk through a quick, practical example.
Imagine you have a machine scheduled to run for an 8-hour shift, which is 480 minutes.
- Calculate Availability:
- Planned production time is 480 mins – 60 mins of planned downtime = 420 minutes.
- Unplanned downtime is 60 minutes, leaving 360 minutes of actual run time.
- Availability = (Actual Run Time / Planned Production Time) = 360 / 420 = 85.7%
- Calculate Performance:
- Ideal run rate is 100 parts per hour. In 360 minutes, it should produce 600 parts.
- It produced 540 parts due to minor stops and slow running.
- Performance = (Total Parts Produced / Potential Parts in Run Time) = 540 / 600 = 90%
- Calculate Quality:
- Out of 540 parts, 27 were defective, leaving 513 good parts.
- Quality = (Good Parts / Total Parts Produced) = 513 / 540 = 95%
- Calculate Overall OEE:
- OEE = 85.7% x 90% x 95% = 73.3%
A score of 73.3% means you only made good products for about 73 minutes out of every 100 planned minutes. The calculation immediately shows where to focus—here, Availability is the biggest issue.
Why OEE Drives Improvement
OEE isn’t just a report card; it’s a diagnostic tool. It uncovers the hidden factory, the untapped potential within your current assets.
When you see a low OEE score, ask “Which component is hurting us the most?” The data points the way.
- If Availability is low, focus on reducing downtime through better maintenance or faster changeovers.
- If Performance is the issue, investigate minor stops or slow cycles.
- If Quality is dragging you down, launch a quality improvement initiative to reduce defects.
I’ve seen this work time and time again. At one food processing plant, management thought slow speeds were the problem. But OEE data revealed Availability was the real issue due to long, disorganised changeovers. Instead of buying new machines, they streamlined the process, cutting changeover time in half and boosting OEE by 15 points.
Getting Started With OEE
Start small. You don’t need expensive software on day one. Use a clipboard, stopwatch, and calculator.
- Pick One Machine: Choose your bottleneck machine—the one that governs your line’s pace.
- Collect Data Simply: Work with operators to log downtime events and count parts.
- Be Honest and Consistent: Record real numbers, not ideal ones.
- Calculate and Communicate: Share results with the team, post charts, and ask for ideas.
Once you have a baseline, prioritise the biggest losses. Start small improvement projects, celebrate wins, and move to the next issue. This is continuous improvement.
Measure What Matters
In a busy manufacturing environment, it’s easy to get lost in the daily chaos. It’s easy to feel like you’re working incredibly hard just to stand still. OEE provides a compass. It simplifies the incredible complexity of your operations into one, meaningful number that tells you where you are and points you in the direction you need to go.
By focusing on Availability, Performance, and Quality, you stop chasing symptoms and start addressing the root causes of lost productivity. You empower your teams with data, not opinions, and create a shared language for improvement. It’s about making smarter decisions, focusing your efforts, and unlocking the potential that’s already sitting on your factory floor.
So, don’t wait for the perfect system or for someone to give you a grand strategy. Pick a machine. Grab a clipboard. Start measuring what truly matters. You might be surprised by what you find. The journey of improvement is ongoing, and each step forward is a step towards greater efficiency and productivity. Embrace the process and let OEE guide you to a more effective and streamlined operation. With time, you’ll see how small changes can lead to big results, transforming your factory floor into a hub of efficiency and success. The power of OEE lies in its simplicity, but its impact can be profound, helping you unlock the hidden potential of your operations and achieve sustainable growth. By focusing on the data and working collaboratively, you can turn challenges into opportunities and create a culture of continuous improvement that drives long-term success.
If you and your team are serious about learning the tools to make this happen, then taking a structured course like our Lean Coaching for Manufacturers is the perfect next step to guide you on that journey.
More Blog Posts
Why Lean Initiatives Fail After 6 Months (and How to Stop It)

The Push vs Pull Debate: Why Volume and Variability Make the Call
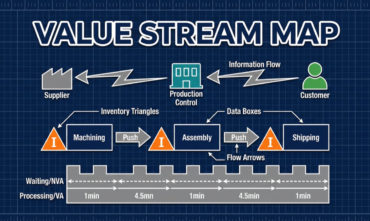
The Anatomy of a Value Stream Map: How to Identify Non‑Value‑Added Time

From Firefighter to Coach: 5 Traits That Define True Lean Leadership

Takt Time vs. Cycle Time: Understanding the Heartbeat of Your Factory

The £50,000 Question Kevin Didn’t Ask: Why Your Lean Program is Failing in Silence


To leave me a message or book a return call at a time that suits you