Overall Equipment Effectiveness
A Good Place to Start for Productivity Improvements
OEE (Overall Equipment Effectiveness) is one of the main measures I use within a Manufacturing Business, but it can be adapted to service as well.
- Does your production have bottlenecks you’re not aware of?
- Could one machine be dragging down the entire facility?
- Do you know if your equipment has excess capacity that could be easily and inexpensively tapped?
OEE is simple and practical. It takes the most common sources of productivity loss and places them into three primary categories, it distils them into metrics that are an excellent gauge for where you are now and more importantly where you need to improve. There are other forms of effectiveness calculations for the supply chain, these are explained at the bottom of this article, but for now it’s back to OEE.
How we make O.E.E work?
- Must be easy to use
- All data must be accurate
- Data must be easy to collect
- Must involve all cell members
- You need to react to the results
The three categories being:
- Availability (%) – The percentage of the planned production time during which the cell could be productive.
- Effectiveness (%) – The percentage of planned production time during which the cell was actually productive.
- Quality (%) – The percentage of the total shift time that a cell is producing quality components.
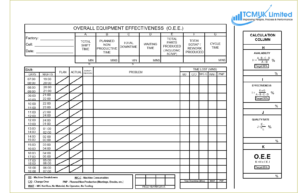
So how do we calculate OEE,
Availability
Total Shift Time – Planned Non Productive – Breakdowns – Changeovers – waiting / Total shift time – Planned Non Productive
Effectiveness
Total Parts Produced x Cycle Time / Total Shift Time – Planned Non Productive – Breakdowns – Changeovers – waiting
Quality
Total Parts Produced –Scrap/Rework / Total Parts Produced
These three primary categories (as a percentage) multiplied together = OEE.
Example,
Total Shift Time 600mins
Planned Non Productive 60mins
Total Downtime 0mins
Waiting 20mins
Total Pats Produced 395
Cycle Time 1min
Scrap 89
Availability = 600-60-20 / 600-60 = 520 / 540 x 100 = 96%
Effectiveness = 395 / 520 x 100 = 76%
Quality = 395-89 / 395 = 306 / 395 x 100 = 77%
OEE = 96 x 76 x 77 = 56%
There are different ways to use the calculation within the supply chain, the following are examples
Goods Inwards
Components Available for use X On time Delivery Performance X Quality of Incoming Goods
Outgoing Performance
Customer Availability of Supplied Goods X Delivery Performance X Quality of Shipped Goods
Overall Supply Chain Effectiveness
You can also measure the supply chain from a Quality, Cost, Delivery point of view as well using OEE, OLE (Overall Logistics Effectiveness) and OPE (Overall Purchase Effectiveness) these three multiplied together forms the Overall Supply Chain Management Effectiveness.
World Class OEE
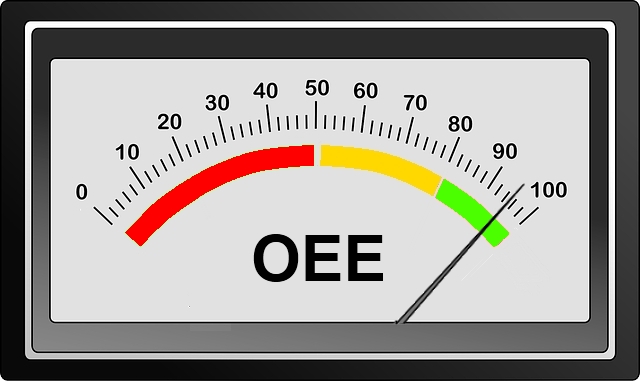
Rule of thumb states that World Class OEE levels are 85%. But industry average is spoken about at 60%, so room for improvement. How’s yours?
0330 311 2820
More Blog Posts


To leave me a message or book a return call at a time that suits you


