It’s easy to feel like a factory tour is something that happens once every couple of years, but in reality, it’s something that should happen every day. Conducting regular factory tours and assessments is crucial for maintaining operational efficiency, safety, and overall productivity. This regular review helps factory managers and supervisors identify areas of improvement and ensure that their operations are lean and effective.
Walking your factory floors is not just a managerial activity; it’s an opportunity to observe, learn, and communicate with your workforce. There are nine key items to consider when assessing the lean nature of your factory. These elements provide a comprehensive framework for evaluating your factory’s effectiveness and identifying opportunities for improvement.
1. Work Stations
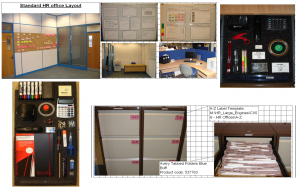
The first item to consider is the state of your workstations. A clean, organised workstation is a hallmark of a well-run factory. Are the workstations free from unnecessary material and equipment? Are tools organised, identified, and easy to find? The 5S methodology (Sort, Set in order, Shine, Standardise, Sustain) is a great tool to ensure that workstations are kept in optimal condition.
Visual labelling, proper lighting, and cleanliness are crucial. Workstations should be well-lit to prevent accidents and ensure that employees can work efficiently. Equipment needs to be clean and in good working order. Supervision and support personnel should be present on the shop floor to provide immediate assistance and oversight. Metal-on-metal contact, safety hazards, and debris on the floors are signs of poor workstation management. Even the cleanliness of the bathrooms can provide insights into the overall maintenance of the facility.
2. Monuments
Monuments refer to large, immovable machines that are anchored to the floor. These machines often require materials to be delivered to them, which can disrupt the flow of production and reduce flexibility. It’s important to evaluate whether these monuments are still in use and if they are contributing to inefficiencies in your production process.
Not all older machines are inefficient; some are purpose-built and offer flexibility in cellular manufacturing. The key is to assess whether machinery, material locations, and drop-off points can be easily rearranged to improve workflow and reduce bottlenecks.
3. Work in Process (WIP)
Excessive Work in Process (WIP) is a clear indication of inefficiencies in the production process. Are there piles of WIP accumulating on the factory floor? Has some of it been there so long that it has grown roots or celebrated multiple birthdays? Each piece of WIP should have associated paperwork, and there should be a clear process for managing and prioritising hot items.
In an ideal factory, WIP should be minimised, and the only WIP present should be classified as Standard in Process Stock (SIPS), meaning it is controlled and part of the regular workflow. Reducing WIP can lead to significant improvements in efficiency and productivity.
4. Visibility of Targets and Schedules
Can everyone in your factory see if they are on target or behind schedule? Hour-by-hour monitoring or close-to-real-time tracking is essential for maintaining productivity and identifying issues as they arise. Using visual indicators like red and green colours can help distinguish between normal and abnormal conditions.
When abnormalities are identified, they should be recorded and analysed to determine the root cause and implement corrective actions. This proactive approach helps prevent recurring issues and ensures that production stays on track.
5. Team Metrics
What metrics do your teams have to measure their performance? Charts, graphs, and objectives should be posted in the work area, and these should be standard documents that are revision controlled, time and date stamped. Metrics need to be up-to-date, regularly reviewed, and actionable.
Having clear metrics allows teams to see if they are meeting their targets and identify areas that need improvement. It also helps distinguish between normal and abnormal conditions, enabling quick responses to emerging issues.
6. Materials at Point of Use
Efficient material delivery is crucial for maintaining a smooth production flow. Are materials delivered to or stacked at the point of use? If a worker loses a component like a screw, nut, or rivet, do they have to go to the stockroom to retrieve another one? This can cause significant delays and disrupt the workflow.
Assess how items are replenished and whether the process depends on cranes or forklifts. Implementing a just-in-time (JIT) system where materials are delivered exactly when needed can reduce inventory costs and improve efficiency.
7. Product Flow
How does the product flow through your factory? Is it through a cell, moving line, or in large batches or lots? Associates should be positioned close together so they can communicate easily, see each other’s WIP, and assist if something goes wrong.
A smooth product flow reduces bottlenecks and ensures that production processes are efficient. It also fosters a collaborative environment where workers can support each other and address issues promptly.
8. Testing and Inspection
Where is the product inspected and tested? Are inspections conducted by the associates themselves, or does the product move to a separate area for inspection? Having large numbers of inspectors can indicate inefficiencies, and a backlog in inspections can delay the production process.
Defects should be recorded, reviewed, and actioned. Tracking defects and implementing corrective actions can help reduce their occurrence and improve product quality over time.
9. Communication and Engagement
The most important aspect of assessing your factory is communication. Show dignity and respect at all times, question and challenge, talk to the people on the front line, and ask why. Understanding the perspectives of those directly involved in production is invaluable for identifying issues and opportunities for improvement.
Engage with your workforce, use your senses to observe, and foster an environment where open communication is encouraged. This approach not only improves operations but also boosts morale and job satisfaction.
In-Depth Exploration
Now that we have outlined the nine key points to consider when assessing your factory, let’s delve deeper into each aspect to provide additional background context, examples, and expert opinions.
1. Workstations: The Foundation of Productivity
Workstations are the foundation of productivity in any factory. A well-organised workstation minimises the time workers spend searching for tools and materials, reduces the risk of accidents, and enhances overall efficiency. The 5S methodology is widely recognised as a best practice for maintaining organised workstations.
- Sort: Remove unnecessary items from the workspace.
- Set in Order: Arrange tools and materials for easy access.
- Shine: Keep the workspace clean.
- Standardise: Establish consistent cleaning and organisation procedures.
- Sustain: Maintain and review standards regularly.
For example, Toyota, a pioneer in lean manufacturing, has implemented the 5S methodology across its production facilities. This approach has significantly improved their operational efficiency and reduced waste.
2. Monuments: Balancing Flexibility and Efficiency
Monuments, or large immovable machines, can be a significant barrier to flexibility in a production environment. While they are often necessary for specific manufacturing processes, it’s essential to evaluate their impact on workflow and efficiency.
In some cases, investing in more flexible machinery that can be easily rearranged can lead to substantial improvements. For instance, a study by the Lean Enterprise Institute found that companies that replaced monuments with more adaptable equipment saw a 30% increase in production efficiency.
3. Work in Process (WIP): Controlling Inventory Levels
Excessive WIP can tie up valuable resources and space, leading to inefficiencies. Implementing a pull system, where production is driven by actual demand rather than forecasts, can help control WIP levels.
Kanban, a scheduling system that visualises work and inventory levels, is an effective tool for managing WIP. By using Kanban cards to signal when new materials are needed, factories can reduce excess inventory and improve flow.
4. Visibility of Targets and Schedules: Real-Time Monitoring
Real-time monitoring of targets and schedules is crucial for maintaining productivity. Digital dashboards and visual management tools can provide instant insights into production status and help identify issues quickly.
For example, General Electric (GE) uses real-time monitoring systems across its production facilities. These systems provide up-to-the-minute data on production performance, enabling quick responses to any deviations from the plan.
5. Team Metrics: Data-Driven Decision Making
Having clear and actionable metrics allows teams to make data-driven decisions. Metrics should be aligned with overall business goals and regularly reviewed to ensure they remain relevant.
Key performance indicators (KPIs) such as cycle time, throughput, and defect rates provide valuable insights into production performance. Regularly reviewing these metrics helps identify trends and areas for improvement.
6. Materials at Point of Use: Just-In-Time Delivery
Just-in-time (JIT) delivery is a cornerstone of lean manufacturing. By delivering materials exactly when they are needed, factories can reduce inventory costs and minimise waste.
For example, Honda has implemented JIT delivery across its production facilities, resulting in significant cost savings and improved efficiency.
7. Product Flow: Streamlining Processes
A streamlined product flow reduces bottlenecks and ensures that production processes are efficient. Techniques such as value stream mapping can help identify and eliminate waste in the production process.
By mapping out the entire production process, factories can identify areas where delays and inefficiencies occur and implement improvements to enhance flow.
8. Testing and Inspection: Ensuring Quality
Effective testing and inspection processes are essential for maintaining product quality. Implementing in-line inspection, where quality checks are integrated into the production process, can help identify defects early and reduce rework.
For example, Boeing has implemented in-line inspection in its aircraft manufacturing process, resulting in higher quality products and reduced production time.
9. Communication and Engagement: Fostering a Collaborative Environment
Open communication and engagement with the workforce are crucial for identifying issues and opportunities for improvement. Regular team meetings, suggestion programs, and employee feedback mechanisms can help create a collaborative environment where continuous improvement is encouraged.
For instance, Toyota’s approach to continuous improvement, known as Kaizen, involves all employees in identifying and implementing improvements. This approach has been instrumental in Toyota’s success and is widely regarded as a best practice in lean manufacturing.
Key Takeaways
Assessing the effectiveness of your factory is an ongoing process that requires regular reviews and a commitment to continuous improvement. By focusing on the nine key areas outlined above, factory managers can identify opportunities for improvement and implement changes that enhance efficiency, productivity, and overall performance.
Regular factory tours and assessments provide valuable insights into the state of your operations and help ensure that your factory remains competitive in an ever-evolving market. By fostering a culture of continuous improvement and engaging with your workforce, you can create a productive and efficient factory that meets the demands of today’s dynamic business environment.
Remember, the journey to lean manufacturing is never complete. It requires ongoing effort, regular reviews, and a commitment to excellence. Now, armed with these insights and best practices, go look, see, and improve your factory’s operations.
0330 311 2820
Book a Return Call at a time that Best Suits You “HERE”


