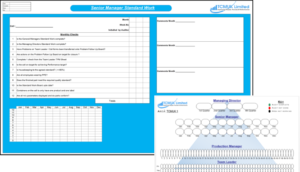
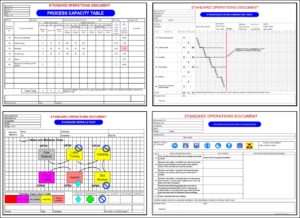
“Performance Rooms” a powerful Visual Management Tool.

Over the last few months I had a number of discussions regarding what I call “Performance Rooms” others call “War Rooms” (never really been keen on that expression but as long as the process is followed what does it matter) or the Japanese term “Obeya Rooms”. I will use Obeya in this article.

These rooms and the disciplined approach to the process behind them helps businesses to reach their strategic/tactical goals and promotes the creation of solutions and actions that can be developed and implemented quickly. The aspect of Managing Performance Improvement for any business undertaking Growth or Lean.

Strategy Room

The following is an overview to understand the theory behind it.

Obeya is based on a simple idea that we dedicate: time, space, the coordination to root cause analysis and problem solving so that organisational barriers are minimised. This ability to maintain a disciplined approach to real-time problem awareness, listening to team members concerns, making discoveries, resolving problems, collaborating and above all developing/mentoring our people is critical to the success of a business.

They promote the coordination and implementation of Strategic and Tactical issues by mobilising and pulling together the intellectual resources of all employees in the service of the firm.

The following are different types of Obeya Rooms (not limited to):

Product Launch; when developing a new product, managers responsible for decision making in design, production engineering, and manufacturing gather in one place to shorten the lead-time through real-time problem resolution.

Business Process Layout: Centralised data collection, prioritising and action planning.

Focused: Project Performance Rooms, SQPDC, A3 Problem Solving, Continuous Improvement rooms.

Observations to consider when looking at Obeya Rooms :

  • Use two colors when tracking status, Red and Green. This avoids ambiguities; the status is ON TARGET or NOT.
  • Define SMART metrics (Specific, Measurable, Attainable, Realistic, Timely), no more than 3-5 focused metrics as more would be impractical for every day review.
  • Problem, Follow-Up and Countermeasure Boards are mandatory, the team must be prompted to solve issues immediately. The deferment/stalling to solving the problem is not allowed.
  • Meeting Discipline – Punctuality, Question and Challenge with dignity and Respect and the meeting should last no more than 30mins.
  • The flow for review takes the shape of Check, Plan, Do, Check, Act instead of the normal PDCA.

0330 311 2820

Book a Return Call at a time that Best Suits You “HERE

A3 Problem-Solving – How To Tell the Story On One Sheet of Paper.

I was chatting with a few contacts recently, and the topic of A3 Problem Solving came up. It got me thinking, and I figured it was worth doing a quick overview of what it is and, more importantly, why it’s so surprisingly effective.

We’ve all been there, haven’t we? Staring at a 40-page report that’s landed in our inbox, complete with dense paragraphs, endless charts, and a conclusion that, if we’re honest, we’ll probably just skip to. Or maybe we’re the ones writing it, spending days crafting the perfect document, only to suspect it will be skimmed at best and ignored at worst. There’s a kind of corporate theatre to it all. We create these huge, comprehensive documents to prove we’ve done the work, but do they actually help anyone think better or make better decisions? Most of the time, I’d argue they don’t. They bury the essential story under a mountain of information.

This is where a beautifully counter intuitive idea comes into play. The idea that you can achieve more clarity, better thinking, and stronger alignment with less. Specifically, with a single sheet of A3 paper.

Problem solving, at its heart, is a thinking-intensive activity. But the act of writing things down, of structuring our thoughts, can massively amplify the quality of that thinking. It forces us to move from a jumble of ideas in our heads to a logical, coherent narrative. The A3 process is a framework designed to do exactly that. It guides us to document key information and decisions at each step of a problem-solving journey. This document then becomes a living thing, something that can be shared with others to get their input, to challenge our assumptions, and to build a shared understanding before any final decisions are made.

It sounds simple, and in many ways it is. But its power lies in a discipline that most of our modern reporting has lost.

So, Why A3? A Quick History Lesson

Let’s get the most obvious question out of the way first. Why the name A3? It’s almost comically practical. The methodology was pioneered at Toyota, a company famous for its relentless focus on efficiency and continuous improvement. Back in the day, much of their communication across different sites, and even different countries, was done by fax. And A3, which is roughly 29 by 42 centimetres, just happened to be the largest size of paper that could reliably fit through a fax machine.

It’s an amazing little detail, I think. A world changing management philosophy constrained and shaped by the technology of the time. It’s a perfect reminder that innovation doesn’t always come from some grand, abstract vision. Sometimes it’s born from very real, very mundane limitations. The size constraint wasn’t an afterthought; it was a foundational element that forced a particular kind of discipline. You couldn’t just keep adding pages. You had to be concise. You had to make every word and every chart count.

This little piece of history is crucial because it gets to the very soul of the A3 report. The key fundamental is not the rigid format, the specific boxes you have to fill in, or the finesse with which you create fancy drawings and charts. To be honest, a beautifully designed A3 that reflects shallow thinking is completely useless. The real point, the thing that makes it all work, is the communication process it enables.

The A3 is the physical manifestation of a problem solving journey. It’s a tool that underpins a deeper process of critical thinking and collaborative decision making. It allows the most critical information about a problem, from its background to the proposed solution, to be distilled onto a single page. This can then be shared across the business, allowing others to quickly evaluate the thought process behind it. It becomes a formal means for requesting support and advice, which in turn aligns everyone in the organisation on how the problem will be tackled and moved forward. It transforms problem solving from a solo activity into a team sport.

Anatomy of an A3 Report

If you look at a typical A3 template, you’ll see it’s laid out to tell a story, flowing logically from left to right and top to bottom. While the exact layout isn’t set in stone, as I mentioned, the format is not the main point, most successful A3s follow a structure that mirrors the Plan Do Check Act, or PDCA, cycle. It guides you through a systematic process, ensuring no critical steps are skipped.

A3 Problem-Solving Template

Let’s break down the typical sections.

  1. Title or Theme: This is the headline. It should concisely define the problem you’re trying to solve. Something like, “Reducing Customer Wait Times in the Support Queue” or “Improving the Accuracy of Monthly Financial Forecasts.” It needs to be clear and specific, framing the entire document.
  2. Background / Current Condition: This is where you set the scene. Why is this problem important? Who does it affect? What is the business impact? This section isn’t about opinions; it’s about facts. You need to go and see the process for yourself, what lean practitioners call genchi genbutsu. You should include data, charts, or simple diagrams to show the current state. What does the process look like right now? What is the performance? This section grounds the problem in reality.
  3. Goal / Target Condition: If the last section was about where we are, this is about where we want to be. What does success look like? The key here is to be incredibly specific and measurable. “Make things better” is not a goal. “Reduce average customer wait time from 4 minutes to 90 seconds by the end of Q3” is a goal. It should be a clear, unambiguous statement that leaves no room for interpretation. This target becomes the benchmark against which you’ll measure your success.
  4. Root Cause Analysis: To me, this is the absolute heart of the A3. It’s where the real thinking happens. It’s also the step that is most often rushed or skipped entirely in traditional problem solving. We see a problem, we jump to a solution. The A3 process forces you to slow down and ask one simple, powerful question, over and over again: Why? This is the famous “5 Whys” technique. You state the problem and ask why it’s happening. Then you take that answer and ask why that is happening. You continue drilling down until you move past the symptoms and uncover the true root cause. Often, the cause you end up with is completely different from what you initially suspected. This section might include a fishbone diagram or a simple bulleted list, but its purpose is to show a clear, logical chain of reasoning from the problem to its source.
  5. Countermeasures / Proposed Actions: Only after a thorough root cause analysis can you begin to think about solutions. Notice the word “countermeasures,” not “solutions.” It’s a subtle but important distinction. A countermeasure is a specific action designed to address a specific root cause. This section should directly link back to your analysis. If a root cause was “Inadequate training on the new software,” a countermeasure would be “Develop and deliver a mandatory 2 hour training module for all team members.” You’re not just throwing ideas at the wall; you’re proposing targeted interventions.
  6. Implementation Plan: This is where the plan becomes real. An idea without a plan is just a wish. For each countermeasure, you need to define who is responsible, what specific tasks need to be completed, and when they need to be done by. It’s a simple table: What, Who, When. This creates accountability and turns a good idea into a concrete project.
  7. Follow Up / Verification: How will we know if our countermeasures actually worked? This section closes the loop. It defines the metrics you will track, which should be directly related to the goal you set at the beginning. It also specifies when and how you will check the results. Are you going to review the data weekly? Monthly? This step ensures that the A3 isn’t just a one time exercise but the start of a continuous improvement cycle.
  8. Results and Learning: Finally, once the plan has been implemented and enough time has passed, you document what actually happened. Did you hit your target? If so, great. What did you learn that you can apply elsewhere? If not, why not? This is just as valuable. An A3 that shows a failed experiment is not a failure; it’s a source of incredible learning. This final section captures that knowledge for the rest of the organisation.

The Real Magic: A Tool for Thinking and Talking

So, that’s the structure. But if you just download a template and fill in the boxes, you’re missing the point entirely. The document is just an artefact; the real value is in the thought process and the conversations it creates.

First, it’s a tool for clarifying your own thinking. The constraint of the single page is a powerful focusing agent. You can’t waffle. You can’t hide behind jargon or bury weak arguments in long paragraphs. You have to be brutally economical with your words. The process of trying to fit a complex problem onto one sheet forces you to simplify, to prioritise, and to make sure your logic is sound. You can literally see the connections between the problem, its root cause, and the proposed fix. It makes your thinking visible, not just to others, but to yourself.

Second, and perhaps more importantly, the A3 is a catalyst for communication and collaboration. In a typical corporate setting, a proposal or report is often worked on in isolation and then presented in a big meeting, a “big reveal” moment. This often puts people on the defensive. They poke holes in it, ask questions the presenter isn’t prepared for, and the whole thing can descend into conflict or get bogged down in debate.

The A3 process flips this on its head. The A3 is meant to be a draft, a conversation starter. The idea is to take your messy, pencil drawn A3 and walk it around to the key stakeholders. This process is sometimes called nemawashi in Japanese, which translates literally to “turning the roots.” It’s about carefully building consensus from the ground up. You show it to your manager, to the people who work in the process, to colleagues in other departments. You don’t present it; you ask for their help. “Here’s what I’m thinking, what am I missing?” “Does this data look right to you?” “What are your thoughts on these countermeasures?”

This approach does a few wonderful things. It enriches the A3 with diverse perspectives, making the final outcome much stronger. It builds buy in from the very beginning, because people feel they have been part of the solution finding process. And it fosters a culture of coaching. A good manager doesn’t just approve or reject an A3. They ask probing questions. “Why did you stop your root cause analysis there?” “How confident are you that this countermeasure will achieve the full target?” They coach the author to think more deeply, turning every problem into a development opportunity.

How to Start Your First A3

If any of this sounds interesting, my advice is simple: just try it. Pick a small, nagging problem that you’re familiar with. It doesn’t have to be a multi million pound production issue. It could be something as simple as “Team meetings consistently run over time” or “The process for submitting expense reports is confusing.”

And please, for your first few attempts, follow the original author’s advice and use a pencil and a physical piece of paper. I know it sounds old fashioned, but there’s a reason for it. A PowerPoint or a fancy software template can create a false sense of finality. It looks polished, so we become reluctant to change it. A pencil and paper, on the other hand, feels temporary and iterative. It gives you permission to be messy, to erase things, to scribble in the margins, and to focus purely on the quality of your thinking, not on your graphic design skills.

Walk through the sections one by one. Go and observe the current condition. Talk to the people involved. Spend a good amount of time on the root cause analysis. Don’t just accept the first answer that comes to mind. Keep asking why. Then, once you have a rough draft, go and talk to someone about it. See what they think. Your first one won’t be perfect, and that’s completely fine. The goal is to practice the thinking discipline, not to create a masterpiece.

Over time, you’ll find that the structure becomes second nature. It becomes an internal mental model for how you approach any problem, whether you’re formally writing an A3 or not.

A Way of Thinking for Everyone

While the A3 report was born on the factory floors of Toyota, its application is truly universal. It’s a mistake to see it as just a manufacturing tool. At its core, A3 thinking is simply a structured, collaborative, data driven approach to problem solving. And what part of a business couldn’t benefit from that?

Think about it.

A marketing team could use it to analyse why a particular campaign underperformed, digging into root causes related to audience targeting, messaging, or channel selection, rather than just shrugging and moving on to the next thing.

An HR department could use it to tackle a problem like high employee turnover in a specific team. Instead of jumping to solutions like a pay rise, they could use the A3 process to uncover deeper issues related to management style, workload, or career development opportunities.

An IT team could use it to finally solve a recurring network outage, systematically investigating the root cause instead of just rebooting the server every time it happens.

Even at a strategic level, a simplified A3 format can be used to propose a new business initiative, outlining the current market condition, the proposed goal, the analysis behind the proposal, and a high-level implementation plan, all on one page for senior leaders to review.

The principles are always the same: Go see for yourself. Grasp the current situation. Analyse down to the root cause. Build consensus around effective countermeasures. And follow through to ensure they work.

In the end, the A3 process is a powerful antidote to the complexity and information overload that plagues so many of our organisations. It’s a call to return to a more disciplined, more thoughtful, and more human way of solving problems. It reminds us that clarity doesn’t come from adding more information, but from stripping away everything that isn’t essential.

It proves that sometimes, the most powerful and persuasive story you can tell is the one that fits on a single sheet of paper.

We’re different it won’t work here

It’s been an interesting month, great meetings, new contacts and one of the most interesting presentations I‘ve given regarding Operational Excellence and Problem Solving.

The presentation was given to the Manufacturing and Construction sectors as part of a Seminar/Workshop.

The comments at the end we’re ones I have heard over and over again, “We’re Different, it won’t work here!

Is “we’re different” an excuse not try to improve?

This got me thinking in one of my reflective moments, what is it that naturally creates this push back? Do we think that Business Excellence, Operational Excellence, Lean or Six Sigma is a technical tool and technique, only applied to manufacturing, high volume processes, etc? Is it we naturally assume that it’s for the automotive industry?

There are a number of answers you can come up with that can be assigned to this emotion and push back.

So we have to ask ourselves

Do business improvement principles (as that is all they are) apply to pretty much every process? Yes, I’d say so. Does that mean its easy to put in place? Absolutely not. But that, along with being different, should be no reason to not try.

Which leads me on from last month’s article REFLECTION! and into OPERATIONAL EXCELLENCE TRANSFORMATION

We must first seek to understand what is it we are trying to solve, what problem? This could be as an organisation, function, sub-process.

Then we must ask,

What process improvement needs to be done? What do I need to design, re-design, improve to solve our problem and achieve our objective?

Next,

Do I have the capability in house? Do I have the skillset within my team?

We then come to,

What mindset do I need to have? Growth? (One of learning as we do not have the capability in house), Implementation (I have the capability so execute, or get support if you don’t), Experimental (try and test)

Remembering that Leadership behaviour and Programme Management are the key. The governance process you apply.

Final thought – it’s often said that “Operational Excellence doesn’t succeed or fail… it’s just a set of principles. What succeeds or fails is the organisation or the leaders who try.” Success isn’t guaranteed — it requires hard work and creativity to figure out how will work in your setting, because you are different!

0330 311 2820

Book a Return Call at a time that Best Suits You “HERE

Reindustrialising Britain.

Just reading though an article (again) in the UK Manufacturing Review and felt compelled to quote James Selka (CEO of The Manufacturing Technologies Association).

I have to say James is spot on with his comments.

“We are living through an explosion in the potential of technology, and it provides a most wonderful opportunity to reinvigorate the manufacturing sector in the 21st century.”

“Manufacturing is remarkable because of the multiplier effect that the sector has. It is so complex, and touches so many other sectors, that activity in it acts as a stimulus to the economy as a whole.”

“As technology becomes more central to the process of manufacturing, the cost of labour – the rationale for much of the offshoring that took place – is a smaller and smaller proportion of the cost of manufacturing activity. Labour cost becomes less of a driver…”

“This is not just about what others can do for us, but what we – UK Manufacturing – can do to help ourselves”

Extracts taken from the UK Manufacturing Review 2015 -16 (Stirling Media).

0330 311 2820

Book a Return Call at a time that Best Suits You “HERE

How Good is Your Factory? Are there Opportunities?

It’s easy to feel like a factory tour is something that happens once every couple of years, but in reality, it’s something that should happen every day. Conducting regular factory tours and assessments is crucial for maintaining operational efficiency, safety, and overall productivity. This regular review helps factory managers and supervisors identify areas of improvement and ensure that their operations are lean and effective.

Walking your factory floors is not just a managerial activity; it’s an opportunity to observe, learn, and communicate with your workforce. There are nine key items to consider when assessing the lean nature of your factory. These elements provide a comprehensive framework for evaluating your factory’s effectiveness and identifying opportunities for improvement.

1. Work Stations

The first item to consider is the state of your workstations. A clean, organised workstation is a hallmark of a well-run factory. Are the workstations free from unnecessary material and equipment? Are tools organised, identified, and easy to find? The 5S methodology (Sort, Set in order, Shine, Standardise, Sustain) is a great tool to ensure that workstations are kept in optimal condition.

Visual labelling, proper lighting, and cleanliness are crucial. Workstations should be well-lit to prevent accidents and ensure that employees can work efficiently. Equipment needs to be clean and in good working order. Supervision and support personnel should be present on the shop floor to provide immediate assistance and oversight. Metal-on-metal contact, safety hazards, and debris on the floors are signs of poor workstation management. Even the cleanliness of the bathrooms can provide insights into the overall maintenance of the facility.

2. Monuments

Monuments refer to large, immovable machines that are anchored to the floor. These machines often require materials to be delivered to them, which can disrupt the flow of production and reduce flexibility. It’s important to evaluate whether these monuments are still in use and if they are contributing to inefficiencies in your production process.

Not all older machines are inefficient; some are purpose-built and offer flexibility in cellular manufacturing. The key is to assess whether machinery, material locations, and drop-off points can be easily rearranged to improve workflow and reduce bottlenecks.

3. Work in Process (WIP)

Excessive Work in Process (WIP) is a clear indication of inefficiencies in the production process. Are there piles of WIP accumulating on the factory floor? Has some of it been there so long that it has grown roots or celebrated multiple birthdays? Each piece of WIP should have associated paperwork, and there should be a clear process for managing and prioritising hot items.

In an ideal factory, WIP should be minimised, and the only WIP present should be classified as Standard in Process Stock (SIPS), meaning it is controlled and part of the regular workflow. Reducing WIP can lead to significant improvements in efficiency and productivity.

4. Visibility of Targets and Schedules

Can everyone in your factory see if they are on target or behind schedule? Hour-by-hour monitoring or close-to-real-time tracking is essential for maintaining productivity and identifying issues as they arise. Using visual indicators like red and green colours can help distinguish between normal and abnormal conditions.

When abnormalities are identified, they should be recorded and analysed to determine the root cause and implement corrective actions. This proactive approach helps prevent recurring issues and ensures that production stays on track.

5. Team Metrics

What metrics do your teams have to measure their performance? Charts, graphs, and objectives should be posted in the work area, and these should be standard documents that are revision controlled, time and date stamped. Metrics need to be up-to-date, regularly reviewed, and actionable.

Having clear metrics allows teams to see if they are meeting their targets and identify areas that need improvement. It also helps distinguish between normal and abnormal conditions, enabling quick responses to emerging issues.

6. Materials at Point of Use

Efficient material delivery is crucial for maintaining a smooth production flow. Are materials delivered to or stacked at the point of use? If a worker loses a component like a screw, nut, or rivet, do they have to go to the stockroom to retrieve another one? This can cause significant delays and disrupt the workflow.

Assess how items are replenished and whether the process depends on cranes or forklifts. Implementing a just-in-time (JIT) system where materials are delivered exactly when needed can reduce inventory costs and improve efficiency.

7. Product Flow

How does the product flow through your factory? Is it through a cell, moving line, or in large batches or lots? Associates should be positioned close together so they can communicate easily, see each other’s WIP, and assist if something goes wrong.

A smooth product flow reduces bottlenecks and ensures that production processes are efficient. It also fosters a collaborative environment where workers can support each other and address issues promptly.

8. Testing and Inspection

Where is the product inspected and tested? Are inspections conducted by the associates themselves, or does the product move to a separate area for inspection? Having large numbers of inspectors can indicate inefficiencies, and a backlog in inspections can delay the production process.

Defects should be recorded, reviewed, and actioned. Tracking defects and implementing corrective actions can help reduce their occurrence and improve product quality over time.

9. Communication and Engagement

The most important aspect of assessing your factory is communication. Show dignity and respect at all times, question and challenge, talk to the people on the front line, and ask why. Understanding the perspectives of those directly involved in production is invaluable for identifying issues and opportunities for improvement.

Engage with your workforce, use your senses to observe, and foster an environment where open communication is encouraged. This approach not only improves operations but also boosts morale and job satisfaction.

In-Depth Exploration

Now that we have outlined the nine key points to consider when assessing your factory, let’s delve deeper into each aspect to provide additional background context, examples, and expert opinions.

1. Workstations: The Foundation of Productivity

Workstations are the foundation of productivity in any factory. A well-organised workstation minimises the time workers spend searching for tools and materials, reduces the risk of accidents, and enhances overall efficiency. The 5S methodology is widely recognised as a best practice for maintaining organised workstations.

  • Sort: Remove unnecessary items from the workspace.
  • Set in Order: Arrange tools and materials for easy access.
  • Shine: Keep the workspace clean.
  • Standardise: Establish consistent cleaning and organisation procedures.
  • Sustain: Maintain and review standards regularly.

For example, Toyota, a pioneer in lean manufacturing, has implemented the 5S methodology across its production facilities. This approach has significantly improved their operational efficiency and reduced waste.

2. Monuments: Balancing Flexibility and Efficiency

Monuments, or large immovable machines, can be a significant barrier to flexibility in a production environment. While they are often necessary for specific manufacturing processes, it’s essential to evaluate their impact on workflow and efficiency.

In some cases, investing in more flexible machinery that can be easily rearranged can lead to substantial improvements. For instance, a study by the Lean Enterprise Institute found that companies that replaced monuments with more adaptable equipment saw a 30% increase in production efficiency.

3. Work in Process (WIP): Controlling Inventory Levels

Excessive WIP can tie up valuable resources and space, leading to inefficiencies. Implementing a pull system, where production is driven by actual demand rather than forecasts, can help control WIP levels.

Kanban, a scheduling system that visualises work and inventory levels, is an effective tool for managing WIP. By using Kanban cards to signal when new materials are needed, factories can reduce excess inventory and improve flow.

4. Visibility of Targets and Schedules: Real-Time Monitoring

Real-time monitoring of targets and schedules is crucial for maintaining productivity. Digital dashboards and visual management tools can provide instant insights into production status and help identify issues quickly.

For example, General Electric (GE) uses real-time monitoring systems across its production facilities. These systems provide up-to-the-minute data on production performance, enabling quick responses to any deviations from the plan.

5. Team Metrics: Data-Driven Decision Making

Having clear and actionable metrics allows teams to make data-driven decisions. Metrics should be aligned with overall business goals and regularly reviewed to ensure they remain relevant.

Key performance indicators (KPIs) such as cycle time, throughput, and defect rates provide valuable insights into production performance. Regularly reviewing these metrics helps identify trends and areas for improvement.

6. Materials at Point of Use: Just-In-Time Delivery

Just-in-time (JIT) delivery is a cornerstone of lean manufacturing. By delivering materials exactly when they are needed, factories can reduce inventory costs and minimise waste.

For example, Honda has implemented JIT delivery across its production facilities, resulting in significant cost savings and improved efficiency.

7. Product Flow: Streamlining Processes

A streamlined product flow reduces bottlenecks and ensures that production processes are efficient. Techniques such as value stream mapping can help identify and eliminate waste in the production process.

By mapping out the entire production process, factories can identify areas where delays and inefficiencies occur and implement improvements to enhance flow.

8. Testing and Inspection: Ensuring Quality

Effective testing and inspection processes are essential for maintaining product quality. Implementing in-line inspection, where quality checks are integrated into the production process, can help identify defects early and reduce rework.

For example, Boeing has implemented in-line inspection in its aircraft manufacturing process, resulting in higher quality products and reduced production time.

9. Communication and Engagement: Fostering a Collaborative Environment

Open communication and engagement with the workforce are crucial for identifying issues and opportunities for improvement. Regular team meetings, suggestion programs, and employee feedback mechanisms can help create a collaborative environment where continuous improvement is encouraged.

For instance, Toyota’s approach to continuous improvement, known as Kaizen, involves all employees in identifying and implementing improvements. This approach has been instrumental in Toyota’s success and is widely regarded as a best practice in lean manufacturing.

Key Takeaways

Assessing the effectiveness of your factory is an ongoing process that requires regular reviews and a commitment to continuous improvement. By focusing on the nine key areas outlined above, factory managers can identify opportunities for improvement and implement changes that enhance efficiency, productivity, and overall performance.

Regular factory tours and assessments provide valuable insights into the state of your operations and help ensure that your factory remains competitive in an ever-evolving market. By fostering a culture of continuous improvement and engaging with your workforce, you can create a productive and efficient factory that meets the demands of today’s dynamic business environment.

Remember, the journey to lean manufacturing is never complete. It requires ongoing effort, regular reviews, and a commitment to excellence. Now, armed with these insights and best practices, go look, see, and improve your factory’s operations.


0330 311 2820

Book a Return Call at a time that Best Suits You “HERE

Manufacturing Websites, to web or not to web?

Recently I started a discussion regarding SMEs and their websites, the discussion started with this quote “an interesting observation this week whilst working, how many SMEs lack an all singing all dancing website. What’s the reason, with 90+% of people now looking on line this should be a priority.” Now all singing all dancing to me means bringing a Return on Investment. Here some excellent extracts and comments from the people involved, I’ve tried to get a balance within the discussion, and this is not my area of expertise.

Ashley Pearce: “In research I conducted recently an overwhelming number of those involved with Business Development in the UK Manufacturing Sector didn’t understand the actual function of a website.
Where does it fit in? Is it just a standalone item? Is it our “Digital shopfront“? Is it relevant in our industry?
These were common questions that we arrived at after a short discussion with most. It’s what inspired a number of articles explaining the “System of Modern Sales & Marketing” over on the Manufacturing Network UK Blog.
Fundamentally a Website is often NOT, but SHOULD be seen as, “Part of a System” for attracting, nurturing and converting leads into customers. Can you see the many ways your website & web presence CAN contribute to the system?”

Ashley Pearce: “For me, the most effective way to explain how a website “Fits in” has been to direct them towards the subject of “Inbound Marketing” – with FAIR WARNING. As we say over on the Manufacturing Network Blog almost weekly, “Wear Your Manufacturing Industry Blinkers” when reading anything about marketing your business online.

Most of the information, content and articles out there explaining how it works is NOT written for you, the UK Manufacturer. I think this is why an Integrated approach to Online Marketing and Offline Sales for UK Manufacturing has been very slow to evolve. Lack of “Context” – Explained in the UK Manufacturing Industry context, we may start to see some savvy marketers leaping ahead of the competition”

Garry Taylor: “There is a feeling that unless you can get on the first 2 pages of Google there’s no Point having a Web page. as we don’t actually do sales transactions over the Internet we view as an online brochure with the blog giving any up to date info and an opportunity for feedback plus, small companies are being pushed to pay per click. Everyone knows most people clicking on your sight are not buying so you pay for nothing.”

Richard Stinson: “I spent many years in the engineering sector, from toolmaker to technical sales and I had the privilege of working directly and indirectly with many SME’s as well as the giants like Rolls and BAE. I came to realise quite quickly that the big boys have regular web trawls looking for potential suppliers, just in case their current suppliers let them down or become swamped with work. They literally have a file of reserve suppliers on their list found online. The moral of this story is that unless the SME’s had an effective web presence they were overlooked for many of these lucrative contracts.”

Alan Kent: “Whilst I can appreciate that having a web site might bring you some business, not having one will definitely bring you none. I do feel that it is becoming a bit BS5750-ish though as having a fancy web site costs money that many SMEs would rather channel into capital equipment or a decent salesman who will definitely generate revenues. I can recall putting in a lot of effort into attaining BS5750 in the 1990s which cost a lot of time and money and brought in no sales leads whatsoever. At the time no-one had realised that it was simply a way of showing that you had a process and was never expected to generate leads but without it, you would definitely get no leads.”

Chris Davis: “There are loads of things you can do here. Small web site intelligently constructed .. put stuff on eBay and Amazon have a blog use social media .. Wiki presence .. the list goes on but none of these are difficult or really expensive. It’s not an option to not have a cyber presence?”

Jeremy Wisner: “The topic concerns the need for an ‘All singing/dancing’ website. For many SMEs, operating in specialist niches, it is questionable about the return on such a site. Absolutely, a solid and informative web presence is a must (largely for contact information and credibility). However, it is in the nature of many niche-SMEs that they will know who their potential customers are and will be cultivating B2B relationships via more direct approaches, rather than hoping to WOW website visitors. Niche products and services, by nature, often require specialised knowledge to explain to USP to potential buyers. Of course, retail is a whole different discussion.
90%+ will look online, yes. However, I’d argue that for the niche players, the hard yards have already been covered by the ‘song and dance’ created offline – backed up by effective SEO work – which again strengthens credibility.”

Adam Payne: “Disagree with you Jeremy, when I look at the SMEs including two that we were looking to acquire in a niche market, had limited website presence and no sales and marketing function, relying on word of mouth and guess how they were performing. If you are looking to expand your business you need an online presence, again as an example, recently I was supporting a company to try and source stretch forming, the search was not easy due to again lack of online presence and SEO setup, I ‘m sure to god there are businesses in the UK, but they missed a big opportunity. Now this is not my area, but if you are happy as a business then you stay as you are, but rest assured someone will be around the corner waiting to pounce if you are not bringing in customers, if you are looking to expand you need multiple marketing pillars and a top website is one of those with an inbound marketing approach (blog showing expertise, contact form with call to action, etc).”

Ashley Pearce: “This discussion thread has done a great deal in exposing the core beliefs that sit behind the reason / purpose / ultimate aim behind a website for a B2B Sales focused business.

The purpose of a website for B2C or retail is completely different. The website can have more to do with sales and sales fulfillment than it can with building the confidence of a prospect and developing a relationship.

Just because they look the same on the outside and are accessed via a web browser does not mean they are the “same thing”.

Fact 1: You are not going to receive sales through your company website in the manufacturing industry. You’re not selling products, you’re selling capability.

Fact 2: Buyers do their searching a researching online before EVER reaching out and asking for information, requesting a quote or expressing interest.

Lesson: If your website doesn’t start a conversation with the Buyers and Engineers visiting it, you will be overlooked…”

0330 311 2820

Book a Return Call at a time that Best Suits You “HERE”

Overall Equipment Effectiveness

A Good Place to Start for Productivity Improvements

OEE (Overall Equipment Effectiveness) is one of the main measures I use within a Manufacturing Business, but it can be adapted to service as well.

  • Does your production have bottlenecks you’re not aware of?
  • Could one machine be dragging down the entire facility?
  • Do you know if your equipment has excess capacity that could be easily and inexpensively tapped?

Overall Equipment Effectiveness Losses

OEE is simple and practical. It takes the most common sources of productivity loss and places them into three primary categories, it distils them into metrics that are an excellent gauge for where you are now and more importantly where you need to improve. There are other forms of effectiveness calculations for the supply chain, these are explained at the bottom of this article, but for now it’s back to OEE.

How we make O.E.E work?

  • Must be easy to use
  • All data must be accurate
  • Data must be easy to collect
  • Must involve all cell members
  • You need to react to the results

The three categories being:

  • Availability (%) – The percentage of the planned production time during which the cell could be productive.
  • Effectiveness (%) – The percentage of planned production time during which the cell was actually productive.
  • Quality (%) – The percentage of the total shift time that a cell is producing quality components.

For the Ultimate Productivity Swipe File – ‘click here

So how do we calculate OEE,

Availability

Total Shift Time – Planned Non Productive – Breakdowns – Changeovers – waiting / Total shift time – Planned Non Productive

Effectiveness

Total Parts Produced x Cycle Time / Total Shift Time – Planned Non Productive – Breakdowns – Changeovers – waiting

Quality

Total Parts Produced –Scrap/Rework / Total Parts Produced

Overall Equipment Effectiveness Template

These three primary categories (as a percentage) multiplied together = OEE.

Example,
Total Shift Time 600mins
Planned Non Productive 60mins
Total Downtime 0mins
Waiting 20mins
Total Pats Produced 395
Cycle Time 1min
Scrap 89

Availability = 600-60-20 / 600-60 = 520 / 540 x 100 = 96%
Effectiveness = 395 / 520 x 100 = 76%
Quality = 395-89 / 395 = 306 / 395 x 100 = 77%

OEE = 96 x 76 x 77 = 56%

There are different ways to use the calculation within the supply chain, the following are examples

Goods Inwards

Components Available for use X On time Delivery Performance X Quality of Incoming Goods

Outgoing Performance

Customer Availability of Supplied Goods X Delivery Performance X Quality of Shipped Goods

Overall Supply Chain Effectiveness

You can also measure the supply chain from a Quality, Cost, Delivery point of view as well using OEE, OLE (Overall Logistics Effectiveness) and OPE (Overall Purchase Effectiveness) these three multiplied together forms the Overall Supply Chain Management Effectiveness.

World Class OEE

Rule of thumb states that World Class OEE levels are 85%. But industry average is spoken about at 60%, so room for improvement. How’s yours?

0330 311 2820

Book a Return Call at a time that Best Suits You “HERE

Managing the Product Lifecycle: Forward Planning for Business Longevity

What is the product lifecycle?

Many of us have heard of the Boston Matrix, “cash cows” “rising stars” and so on, however whilst we understand the principle do not build it in to our day to day business. Managing the product lifecycle and using your understanding of this to ensure the longevity of your business is critical to long term success.

For each of our products and services, we should have a thorough understanding of where they are in their product life cycle, is the market for them still growing and developing, is it at its peak or is it already in its downward spiral? We should also have an understanding of what this means for the future of our business, if the product or service which we rely on to make the majority of the profits in our business is on a downward trajectory, that spells trouble and we should be focusing our efforts on other areas of our portfolio and product development.

Determining your place in the product lifecycle

Here are 3 questions you can use for assessing your products and services using the product lifecycle;

What pattern are you seeing in your sales? Are they rising, stagnant or falling?

What are your profit margins doing? Are they rising, stagnant or falling?

How profitable are you products and services? Which ones make you the most money?

Use the answers to these three questions to prioritise your product/services when you are allocating resources. By resources I mean time as well as money. If you have a product or service which is extremely profitable and has a growing market, this is where you should be spending your time, not on one of your older, potentially “classic” products which no longer has a stable market. This may seem like common sense but it can be incredible hard to be that brutally honest with yourself and your business and let go of the products or services that you are emotionally invested in. Use the numbers and the patterns to drive your behaviour, and be brutal about it! If you need help our Business Accelerator Programme might be of interest.

0330 311 2820

Book a Return Call at a time that Best Suits You “HERE

The Process of Improvement for any Business

Standardise

In standardising a process you want to be able to see the Abnormal from Normal conditions. When the process is disrupted by an obstacle or issue, you can see it. The Standardise, Do, Check, Act cycle.

Stabilise

Now you can begin to systematically simplify, Combine, Eliminate the issues to Stabilise the process. Whether it’s achieving TAKT, a cycle time, changeover, order entry, bid-no bid process, etc. The Plan, Do, Check, Act cycle.

Standardise and Stabilise play off of one another. (and you must be applying the rigorous PDCA management process as a business, if you can’t do that or sustain it ultimately you will fail)

Optimise

The drive towards perfection should always be sort within our processes across all functions, departments, businesses. This is optimisation, in driving for continuous improvement. Once we have standardised and stabilised our processes internally we can also start to look externally within our supply chain and support the SDCA and PDCA within those businesses that are struggling, remember we want a way of understanding the Abnormal from Normal conditions, no reason we can’t apply that in measuring our supply chain and why not pass on the learning, we all benefit. (and I don’t mean how some OEM’s have applied this before, internally a mess but let’s concentrate and beat up the supplier, short termism!)

Optimise also goes hand in hand with Grow in my eyes, all of the improvements align to our Strategy, and our Strategy will have new business, innovation in our products, so optimise and utilise all of those resources to ensure future growth.

Grow

Apply the SDCA, PDCA into Sales and Marketing processes. Integrate the tools and techniques of Lean Manufacturing, Operational Excellence with the proven sales methods and drive sustainable increases in sales performance and profitability.

In improving the efficiency of our company’s sales processes, we enable the sales and Customer facing teams to reduce waste and duplication and free up much needed Customer contact time in the sales cycle creating greater customer value.

As the orders come in, we come back to our Standardise and Stabilise cycle and the cycle repeats.

0330 311 2820

Book a Return Call at a time that Best Suits You “HERE


Leadership Alignment

Leadership teams still operate in silos. Commercial don’t talk to operations and vice versa, individual objectives are not aligned to the business needs, Quality stands alone. Your business may have a company vision but is this realised/disseminated throughout the organisation and most importantly of all, is your leadership team aligned to it.

Creating a clear company vision is key to your organisation’s success, but how do you make sure everyone on your leadership team agrees? Now this doesn’t mean that your team need to get on together but it does mean they are fully focussed and completely in agreement on what needs to be delivered.

Make sure everyone on your leadership team is on the same page with a crystal-clear vision for your organisation by AGREEING on the answers to these questions. REMEMBER AGREEING AS A TEAM!.

This walk-through helps your team clarify and agree on your company vision and priorities.


What are your Core Values?

What are the 3-5 characteristics that define who you are as a company, culture and leadership team?


What is your Focus?

What is it your business excels at? What is its core competence? What’s your purpose?


What is your 10 year Vision?

What is the goal you are all working towards? What does the finish line look like?


What is your Marketing Strategy?

Who is your ideal target market? What are your Unique Selling Points you need to tell to the world? What is your proven process for doing business with your customers? What’s your guarantee?


What is your 3 year Strategy

What is the Revenue, Profit and Measurable goals (remembering KPI’s drive behaviour so make sure you have the correct ones)? 3-5 bullet points on what your business will look like in 3 years.


What is your 1 year plan?

What IS the plan, what are the 3-7 most important things that must be done within the next 12 months? (Less is More)


Quarterly Milestones

What are the most important things your team must do in the next 90 days to ensure they hit the 1 year plan to put you on track to make your 3 year Strategy a Reality?


Implement a governance process to ensure execution.

Give time, Space and co-ordination of problem solving so that the organisational barriers are removed.

REMEMBER AGREEMENT AT EVERY QUESTION BEFORE YOU MOVE ON

0330 311 2820

Book a Return Call at a time that Best Suites You “HERE