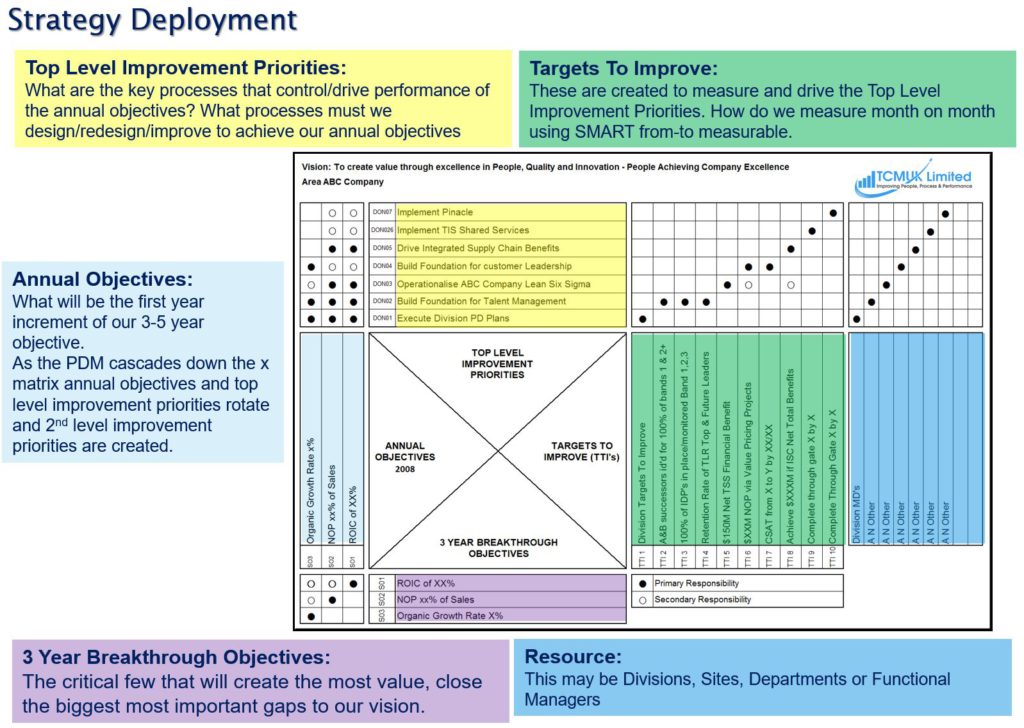
From Vanity Metrics to Victory: How to Build KPIs That Actually Drive Results

Right then. Let’s talk about numbers.

The end of quarter report lands on your desk. Turnover is up. Total units shipped are at a record high. The website has seen a surge in traffic. On the surface, it’s all good news. You lean back in your chair, take a sip of tea, and feel that brief, warm glow of success. We’ve all been there. It feels great.

But then, a nagging feeling creeps in. Why, if turnover is up, are the margins feeling tighter than ever? If you’re shipping more units, why is the operations manager looking permanently stressed and talking about increased rework? And what did all that website traffic actually do?

This, my friend, is the siren song of vanity metrics. They are the numbers that look impressive in a PowerPoint presentation but don’t actually tell you much about the health of your business. They make you feel good, but they don’t help you make good decisions. They are the business equivalent of counting calories without ever looking at the nutritional information.

The truth is, in the world of manufacturing, where every penny and every second counts, focusing on the wrong numbers can be more than just a distraction. It can actively hide serious problems until it’s too late. It can lead you to invest in the wrong areas, reward the wrong behaviours, and ultimately, steer the entire ship in the wrong direction.

But how do you cut through the noise? How do you move from tracking what’s easy to measure to measuring what truly matters? Over the years, I’ve found it comes down to asking the right questions. So, we’re going to walk through a simple, three question framework designed to help you identify the Key Performance Indicators, or KPIs, that will actually drive your manufacturing business forward.

Why Vanity Metrics Are a Dangerous Distraction

Before we get to the solution, we need to properly understand the problem. What exactly is the difference between a vanity metric and a real, hardworking KPI?

A vanity metric is a surface level number. It’s often big, impressive, and easy to track. Think total revenue, number of employees, or social media followers. It tells you that something happened, but it gives you zero context as to why or whether it was a good thing.

A Key Performance Indicator, on the other hand, is directly tied to a strategic business objective. It’s actionable. When a KPI moves up or down, you know whether you’re getting closer to or further from a specific goal, and it often suggests what action you need to take.

Let’s look at some common examples in a manufacturing setting.

Vanity Metric: Total Units Produced.
This number looks fantastic on a chart that goes up and to the right. The board loves it. But what does it really tell you? Nothing about quality. Nothing about efficiency. You could be producing thousands of units with a 20% defect rate that requires costly rework, or you could be running machines into the ground with no preventative maintenance, setting yourself up for a catastrophic failure next month.

A Better KPI: First Pass Yield (FPY).
This measures the percentage of products that are manufactured to specification, without any rework, the first time through the process. A high FPY tells you your processes are stable, your quality is high, and your efficiency is strong. If FPY drops, you know you have a problem on the line that needs immediate investigation. It’s a number that prompts action.

Vanity Metric: Website Traffic.
Your marketing team reports a 50% increase in visitors to your website. Great. But who were they? Were they potential customers in the UK looking for a new component supplier, or were they students from another continent doing research for a project? Did any of them download a spec sheet, request a quote, or call your sales team? Without that context, the number is meaningless.

A Better KPI: Qualified Lead Velocity Rate.
This measures the month over month growth in the number of genuine, qualified leads your marketing and sales teams are generating. It tells you if your pipeline is growing. It’s a direct indicator of future sales potential. It’s a number that the sales director can actually use to forecast and plan.

The danger of vanity metrics is that they create a false sense of security. When the big numbers look good, it’s easy to ignore the underlying issues. It’s like the doctor telling you your weight is stable without checking your blood pressure. You might look fine on the outside, but inside, problems could be brewing. Chasing these metrics encourages teams to focus on activities that boost the number, not activities that improve the business.

Understanding the Power of Leading vs. Lagging KPIs

Okay, so we agree we need to move beyond vanity. The next crucial step is to understand that not all true KPIs are created equal. They generally fall into two categories: lagging and leading. Getting the balance right between these two is probably the single most important part of building a useful dashboard.

Lagging indicators are the ones we’re all most familiar with. They measure outcomes. They are backward looking, telling you the result of things that have already happened. Think of them as the final score of a football match.

  • Monthly Net Profit
  • Customer Churn Rate
  • On Time In Full (OTIF) Delivery Percentage
  • Total Scrap Value

These are all incredibly important. They tell you if you won or lost the game. They validate your strategy and tell you if your past efforts paid off. The problem is, by the time you measure them, the game is over. You can’t go back and change the outcome. If your OTIF for last month was a dismal 75%, you can’t do anything to fix it. The deliveries are already late.

Leading indicators, on the other hand, are predictive. They measure the inputs and behaviours that will likely lead to a future result. They are the things you can influence right now to change the final score. In our football analogy, this would be things like shots on goal, pass completion percentage, or time of possession.

  • Sales Pipeline Velocity (how quickly deals are moving through stages)
  • Percentage of Preventative Maintenance Tasks Completed on Time
  • Average Supplier Quality Score
  • Number of Employee Suggestions Implemented

These are the levers you can pull. If you see that your team is falling behind on preventative maintenance, you can intervene immediately. You can allocate more resources or adjust schedules to get back on track and prevent the future machine downtime that would wreck your lagging KPIs. If your sales pipeline is looking thin, you know you need to ramp up marketing or prospecting efforts now to avoid a bad sales quarter in three months.

To be honest, most businesses I’ve worked with are drowning in lagging indicators. They spend hours every month poring over reports that tell them what went wrong last month. Proactive, successful businesses, however, are obsessed with their leading indicators. They use them as an early warning system, allowing them to solve problems before they become catastrophes.

The 3 Questions to Find the KPIs That Truly Matter

So, how do we get there? How do we build a dashboard that gives us this balanced, forward looking view? It starts by ignoring the giant list of 100 possible metrics you could track and instead asking three simple, powerful questions.

Question 1: What are your core strategic objectives?

This sounds obvious, but it’s the step most often missed. You cannot choose a Key Performance Indicator if you don’t first know what performance you’re trying to indicate. Before you measure anything, you have to be brutally clear about what you are trying to achieve as a business.

And I don’t mean vague goals like “be the best” or “grow the company.” I mean specific, written down objectives. For example:

  • Objective A: Increase overall profitability by 5% in the next fiscal year.
  • Objective B: Reduce customer reported defects by 15% within six months.
  • Objective C: Successfully launch the new X-series product line and achieve £1M in sales in its first year.

Your KPIs must flow directly from these objectives. If a metric doesn’t help you track your progress towards one of these goals, then why are you tracking it? It’s just noise. This first question forces you to connect every number on your dashboard to a genuine business priority. It’s the ultimate filter.

Question 2: Which KPIs directly measure progress toward these objectives?

Once you have a clear objective, you can start brainstorming metrics that measure it. The key here is to choose KPIs that are actionable, relevant, and, of course, measurable. You need to avoid the temptation to pick a metric just because it “looks good” or is easy to get the data for.

Let’s take Objective B: Reduce customer reported defects by 15%.

  • poor KPI choice would be “Total Units Shipped.” As we discussed, this doesn’t tell you anything about quality.
  • good lagging KPI would be “Customer Defect Rate” or “Number of Warranty Claims.” This directly measures the outcome you want to influence. It tells you if you’re succeeding.
  • good leading KPI would be “First Pass Yield,” “In Process Inspection Failure Rate,” or “Percentage of Staff with Up to Date Quality Training.” These are the activities that prevent defects from ever reaching the customer. If these numbers are heading in the right direction, your lagging indicator is almost certain to follow.

The litmus test for a good KPI is this: if this number changes, will it trigger a specific action or decision? If your In Process Inspection Failure Rate spikes, does that trigger a review of the machine setup or the raw material batch? If the answer is yes, you’ve got a winner. If the answer is no, it’s probably a vanity metric in disguise.

Question 3: Are you balancing leading and lagging KPIs?

This final question is your sense check. Look at the KPIs you’ve chosen for each objective. Do you have a healthy mix of both rearview mirror metrics and forward looking predictors?

  • Lagging KPIs are for validation. They confirm whether your strategy worked. They are perfect for reporting to the board and for celebrating successes.
  • Leading KPIs are for management. They are the numbers your operational teams should be looking at daily or weekly to make real time adjustments.

A dashboard with only lagging indicators is like driving a car using only the rearview mirror. You know exactly where you’ve been, but you have no idea what’s coming. A dashboard with only leading indicators can feel a bit abstract; you’re tracking a lot of activity, but you’re not sure if it’s producing the right results.

The magic happens when you pair them. You track Preventative Maintenance Compliance (leading) to influence Machine Uptime (leading), which in turn drives On Time Delivery (lagging) and ultimately, Customer Satisfaction (lagging). Each step in the chain predicts the next, giving you a complete and powerful view of your operations.

Best Practices for Making Your KPIs Work

Identifying the right KPIs is half the battle. The other half is embedding them into the culture of your business so they actually get used.

First, set realistic but challenging targets. A target of “100% On Time Delivery” might be demoralising if you’re currently at 80%. A better approach might be to target 85% this quarter, and 90% the next. The goals should stretch your teams, not break them.

Second, review them regularly. KPIs aren’t meant to be carved in stone. Your business priorities will change. Hold monthly or quarterly KPI review meetings. Ask what the numbers are telling you. Are the targets still right? Are we still measuring the most important things? Be prepared to kill off KPIs that are no longer serving you.

Third, communicate and foster ownership. The person on the shop floor needs to understand why their machine’s OEE (Overall Equipment Effectiveness) matters. Show them how it connects to the company’s goal of improving profitability. Give teams ownership of the KPIs they can influence. When people feel responsible for a number, they will move heaven and earth to improve it.

Finally, and most importantly, use KPIs as triggers for action, not just as a report card. A dashboard should be the start of a conversation, not the end of one. When a KPI turns red, it shouldn’t be about blame. It should be a signal for the team to swarm the problem, understand the root cause, and implement a solution.

Practical Examples for Your Manufacturing Business

Let’s bring this to life with some concrete examples across different functions.

Operations:

  • Leading: Overall Equipment Effectiveness (OEE), Schedule Adherence, First Pass Yield.
  • Lagging: On Time In Full (OTIF), Cost Per Unit, Scrap Rate.

Sales:

  • Leading: Quote to Win Ratio, Sales Pipeline Value, Average Time to Close a Deal.
  • Lagging: Total Revenue, Average Order Value, Customer Acquisition Cost.

Marketing (for Manufacturers):

  • Leading: Number of Qualified Leads from Website/Trade Shows, Spec Sheet Download Rate.
  • Lagging: Marketing Spend per Acquired Customer, Customer Lifetime Value.

Finance:

  • Leading: Days Sales Outstanding (DSO), Inventory Turns.
  • Lagging: Gross Profit Margin, EBITDA, Return on Capital Employed (ROCE).

Notice how for each area, there’s a mix of predictive activities and final outcomes. That’s the balance you’re aiming for.

Bringing It All Together

Look, it’s easy to get lost in a sea of data. It’s tempting to track dozens of metrics because the software makes it possible. But more data doesn’t mean more clarity. Often, it just means more noise.

Chasing vanity metrics feels productive, but it’s a trap. It leads to busy work, not effective work. It masks underlying problems and can lull you into a dangerous sense of complacency.

The power lies in simplicity and focus. By using this three question framework, you can cut through the clutter and build a small, powerful set of KPIs that are tightly aligned with your real business goals.

  1. What are our core strategic objectives?
  2. Which KPIs directly measure our progress?
  3. Are we balancing leading and lagging indicators?

Start small. Pick one critical business objective and apply these questions to it. Build out a mini dashboard with just three or four carefully chosen leading and lagging KPIs. Use them, talk about them, and see what a difference it makes.

So I invite you to do just that. Go back to your desk, pull up your current management report or dashboard, and for each number you see, ask yourself those three questions. Does it pass the test? Or is it just there to make you feel good? The answers might just change the way you run your business. To see how these principles can be applied directly to your organisation, I’d encourage you to explore the Goal Deployment Programme at https://tcmuklimited.co.uk/goal-deployment-programme/. It’s designed to help manufacturers like you make this transition from theory to reality.

From Friction to Flawless Execution: Unifying Your Teams with the X Matrix

Have you ever seen it? The classic standoff. The sales director, beaming, walks back into the office having just landed a massive, company-changing order. High fives all around. Then they walk over to the production manager to share the good news, and the beaming smile is met with a stone-cold stare. The production manager’s first question isn’t “How much revenue is that?” but “When do they need it by? Do you have any idea what this does to our current schedule?”

In a flash, the celebration is over. It’s not one team winning; it’s two departments bracing for a fight.

This, right here, is the quiet killer in so many manufacturing businesses. We call them departmental silos. They’re the invisible walls that spring up between sales, production, engineering, finance, and quality control. Everyone is working hard, everyone is trying to hit their numbers, but they’re not working together. It leads to friction, wasted effort, missed deadlines, and a general feeling of us versus them. To be honest, it’s exhausting for everyone involved.

The problem isn’t usually the people. It’s the system. Or rather, the lack of one. The root of the issue is that each department is playing its own game with its own scoreboard. What if, instead, everyone in the company could see the same game plan, understood their specific role in it, and shared the same scoreboard? That’s what we’re going to talk about. We’ll explore how creating visible, shared objectives, using a powerful but practical framework like the X Matrix, can dismantle those silos and turn competing teams into a single, unstoppable execution force.

The Real Cost of Departmental Silos

Let’s be real for a moment. What do silos actually look like on a Tuesday afternoon in a busy manufacturing plant? It’s not just a theoretical concept; it’s a series of small, frustrating moments that add up to a big problem.

It’s the engineering team spending months perfecting a new product design, only to find out from production that it’s a nightmare to manufacture efficiently, requiring costly new tooling that wasn’t budgeted for.

It’s the finance department chasing the sales team for forecasts, while the sales team is chasing production for lead times, and production is blaming procurement for material delays. It’s a circular firing squad of emails and excuses.

I remember visiting a factory a few years back where the quality team had implemented a new, rigorous inspection process. They were proud of it, and their metrics for ‘defects caught’ went through the roof. The problem? It created a massive bottleneck at the end of the production line. On-time delivery numbers plummeted, and the production team was furious. The quality team hit their goal, but the company, as a whole, failed the customer. Both teams were doing their jobs as they understood them, but they were working at cross purposes.

This isn’t just inefficient; it’s corrosive to your company culture. It breeds a “not my job” mentality. People stop thinking about what’s best for the business and start thinking about how to protect their own patch. Morale takes a nosedive because nobody enjoys coming to work feeling like they’re in a constant battle with their own colleagues. Good people, the ones who want to collaborate and solve problems, eventually get fed up and leave.

So where does this all come from? It’s rarely intentional. It’s the natural result of a few common things:

  1. Isolated Goals: Sales is bonused on revenue. Production is measured on cost per unit and efficiency. Finance is focused on cash flow. When these goals aren’t explicitly linked, they will inevitably conflict.
  2. Unclear Company Vision: If the leadership hasn’t clearly and repeatedly communicated the top 3 to 5 priorities for the entire year, departments are left to invent their own. And they will, based on what seems most important from their limited perspective.
  3. Limited Communication: There’s no regular, structured forum for different team leaders to get together, review progress against a shared plan, and solve cross-functional problems. The weekly production meeting doesn’t count if sales and engineering aren’t there.

Silos aren’t a sign of bad people. They’re a sign of a disconnected strategy. The cost isn’t just in lost efficiency; it’s in lost potential, lost morale, and ultimately, lost customers.

The Case for Shared Objectives

So, what’s the alternative to this siloed chaos? It’s deceptively simple in concept: get everyone aiming at the same target. Think of your business as a rowing team. If the person in the front is rowing towards the left bank, and the person in the back is rowing towards the right, you’re just going to spin in circles and get very tired. The only way to move forward, fast, is for everyone to row in the same direction, in perfect sync.

Shared objectives are your common direction. They create a clear line of sight from the highest-level strategic goals of the company right down to the daily tasks of an individual on the shop floor.

This is where so many businesses stumble. The owner or managing director has a brilliant three-year plan in their head—maybe it’s to expand into a new market, increase profitability by 20%, or become the number one supplier in a specific niche. But that vision stays in the boardroom. It never gets translated into meaningful, tangible goals for the people who actually make, sell, and ship the product.

A truly aligned organisation makes that connection explicit. The process looks something like this:

  • Company Strategic Goal: Increase market share in the North of England by 15% in three years.
  • Annual Company Objective: Launch Product X, which is tailored for the northern market, and secure 10 flagship clients this year.
  • Sales Department KPI: Secure £500,000 in sales for Product X from the target region.
  • Production Department KPI: Achieve a 98% on-time, in-full delivery rate for Product X and maintain a specific cost per unit.
  • Engineering Department KPI: Finalise the Product X design and support production to resolve any manufacturing issues within 24 hours.

Do you see the difference? Suddenly, the goals aren’t in conflict. For the company to win, Sales, Production, and Engineering all have to succeed, and their success is now visibly interconnected. The sales team knows that promising unrealistic delivery dates will hurt production’s ability to hit their target, which ultimately hurts everyone. Production understands that keeping costs down on Product X helps sales be more competitive, which helps everyone.

When objectives are shared and visible, the conversation changes. It shifts from “That’s your problem” to “How can we solve this together?” It clarifies priorities. When a new request comes in, you can ask a simple question: “Does this help us achieve our shared objective of launching Product X successfully?” If the answer is no, it becomes much easier to say no, or to at least question its urgency. It gives your teams a framework for making smart decisions without needing constant supervision.

X Matrix: A Practical Tool for Breaking Down Silos

Okay, so the idea of shared goals is great. But how do you actually manage it without creating a mountain of spreadsheets and confusing documents? This is where a tool like the Hoshin Kanri X Matrix comes in.

Now, don’t let the name intimidate you. It sounds complex, but at its heart, the X Matrix is just a powerful one-page plan that shows the connections between your long-term vision, your annual goals, your key projects, and the metrics you use to measure success. It’s a visual map that everyone in the business can understand.

Imagine a large square divided into four quadrants, with a space in the middle:

  • South Quadrant (Bottom): Long-Term Objectives. This is your “True North.” Where do you want the business to be in 3 to 5 years? These are the big, strategic ambitions. For example: “Become the UK’s most trusted supplier of high tolerance components” or “Achieve carbon-neutral operations.”
  • West Quadrant (Left): Annual Objectives. What do we need to accomplish this year to make progress towards our long-term vision? These are more specific and time-bound. Things like: “Reduce overall waste by 10%,” “Increase on-time delivery from 92% to 97%,” or “Launch our new e-commerce platform.”
  • North Quadrant (Top): Top Improvement Priorities. These are the key projects or initiatives you will execute this year to achieve your annual objectives. Think of them as the “how.” For example: “Implement 5S across the factory floor,” “Renegotiate contracts with top 3 suppliers,” or “Train sales team on new CRM software.”
  • East Quadrant (Right): Metrics to Measure. How will you know if you are winning? These are the key performance indicators (KPIs) that track your progress. Things like “Customer satisfaction score,” “Scrap rate,” “Sales conversion rate,” or “Employee turnover.”
  • Far East (Far Right): Ownership. This is crucial. For every top priority and every key metric, you assign a name. Who is responsible for driving this forward? Accountability becomes crystal clear.

The real power of the X Matrix is in the corners and the centre. This is where you use dots or check marks to show the relationships. You can see exactly which Top Priorities (North) support which Annual Objectives (West). You can see which Annual Objectives link to which Long-Term Goals (South). You can see which Metrics (East) are measuring the success of your priorities.

It forces the critical conversations that break down silos. When you build the matrix as a leadership team, the sales director can see that the “Implement 5S” project isn’t just a tidy-up exercise for production; it’s a critical enabler for reducing lead times, which directly impacts the “Increase on-time delivery” objective that the sales team cares so much about. Everything is connected, and for the first time, everyone can see those connections on a single sheet of paper.

Building Cross-Functional Collaboration

Having a beautiful X Matrix on the wall is a great start, but it’s just a tool. It’s like having a detailed map but never actually starting the journey. The tool only works if you build the right behaviours and rhythms of communication around it. This is about bringing the plan to life.

Here are a few essential enablers for making this work in the real world:

  1. Regular Cross-Team Reviews: The plan is not static. You need a regular heartbeat of accountability. This often takes the form of a monthly or quarterly business review. The key is that this isn’t a series of separate departmental updates. It’s one meeting where leaders from every department review the same plan—the X Matrix. You go through the key metrics. Are they green, amber, or red? If a metric is red, the conversation isn’t about whose fault it is. It’s about which cross-functional priorities are behind schedule and what help is needed to get them back on track.
  2. Transparent Communication Channels: Everyone should be able to see the score. Modern manufacturers use simple digital dashboards—they can be built in Excel, Google Sheets, or more advanced tools like Power BI. These dashboards display the key metrics from the X Matrix in real time, or close to it. When the on-time delivery metric is visible on a screen on the shop floor and on the sales director’s laptop, it becomes a shared reality. There’s no hiding from the data.
  3. Collaborative Training: Don’t just train your teams in their functional skills. Invest in training that brings different departments together. A workshop on Lean principles or problem-solving that includes people from sales, finance, and production can be revolutionary. They start to understand each other’s challenges and learn a common language for improvement. They build personal relationships that make it much easier to pick up the phone and solve a problem later on.
  4. Leadership That Models the Way: This might be the most important piece of the puzzle. If the department heads and senior leaders are seen to be collaborating, challenging each other respectfully, and focusing on the shared objectives, the rest of the organisation will follow. But if they leave the strategy meeting and go back to protecting their own turf, the entire effort will fail. Leaders must consistently use the X Matrix to frame their decisions and communications. They must walk the talk, every single day.

Real World Impact: From Friction to Flow

Let me tell you about a fictional but very typical company: Midlands Precision Engineering. They were a 50-person firm, good at what they did, but stuck. Growth had stalled. Their biggest problem was internal friction. Sales would promise custom jobs with short lead times to win business, which would throw the production schedule into chaos. Production would then cut corners to catch up, leading to quality escapes. The quality team would then clamp down, slowing everything down again. It was a vicious cycle.

They decided to try a new approach. The leadership team spent two days building their first X Matrix. For the first time, they had a heated but productive debate about what truly mattered for the business over the next three years. They agreed on three long-term goals: being the number one choice for quality, achieving 99% on-time delivery, and growing the business by 50%.

From there, they defined their annual objectives and the key projects to get there. One of the top priorities was to create a formal “Sales, Inventory, and Operations Planning” (SIOP) process. This project was co-owned by the heads of Sales and Operations.

What happened? The monthly SIOP meeting became the place where they made promises together. Sales brought their forecast. Production brought their capacity plan. They looked at the data together and agreed on a plan for the next three months. Sales now understood the real constraints of the factory, and production got a much earlier view of demand, allowing them to plan materials and labour more effectively.

Within a year, their on-time delivery had jumped from 85% to 97%. Quality issues dropped because the frantic, last-minute rush jobs became the exception, not the rule. And because they were now a more reliable supplier, they started winning more profitable, long-term contracts. Morale improved dramatically because people were no longer fighting fires; they were working together towards a clear, common goal. The X Matrix didn’t magically solve their problems, but it gave them the map and the compass they needed to solve them together.

Your Next Move

We’ve covered a lot of ground, but the core message is simple. Departmental silos are the default setting in most growing businesses, but they don’t have to be your reality. The antidote is to make your strategy visible, make your objectives shared, and make your teams interconnected. You stop managing departments and start leading a single, unified business.

Frameworks like the X Matrix provide a practical, proven way to do this. They move your strategic plan from a document gathering dust on a shelf to a living, breathing tool that guides daily decisions and fosters genuine collaboration. It’s not about adding more management layers or bureaucracy. It’s about creating clarity, alignment, and accountability. It’s about getting all your best people rowing in the same direction.

If this sounds like the kind of clarity and alignment you’ve been looking for to unlock your business’s true potential, then it might be time to take the next step. To see how these principles can be applied directly to your organisation, I’d encourage you to explore the Goal Deployment Programme at https://tcmuklimited.co.uk/goal-deployment-programme/. It’s designed to help manufacturers like you make this transition from theory to reality.

The Role of Innovation in Driving Growth for UK Manufacturers

Small and medium-sized enterprises (SMEs) make up a significant portion of the manufacturing sector in the UK, and they play a crucial role in driving economic growth and job creation. However, with increasing competition and rapidly evolving technologies, it’s becoming more important than ever for SME manufacturers to innovate in order to stay competitive and achieve long-term growth.

Innovation can take many forms, from developing new products and processes to improving existing ones. By embracing innovation, SME manufacturers can unlock new markets, enhance their production capabilities, and create more value for their customers. Here are some key ways in which innovation can help drive growth in SME manufacturers with two approaches discussed in each section:

Product Innovation

Product innovation is a key way for SME manufacturers to differentiate themselves from competitors and capture new markets. This involves developing new products or improving existing ones in response to changing customer needs, market trends, or technological advancements. Product innovation can take many forms, such as improving product performance, adding new features, or developing new product lines.

One approach to product innovation is to engage with customers to understand their needs and pain points. This can involve conducting market research, surveys, or focus groups to identify gaps in the market and areas where innovation is needed. SMEs can also leverage social media and online platforms to gather customer feedback and insights.

Another approach is to invest in research and development (R&D) to develop new technologies or materials that can be used to create innovative products. This can involve collaborating with universities, research institutions, or other companies to access new knowledge and expertise. SMEs can also explore government funding and grants to support their R&D efforts.

Process Innovation

Process innovation involves improving manufacturing processes to increase efficiency, reduce costs, and improve quality. This can be achieved through the adoption of new technologies, automation of processes, or the streamlining of workflows. By implementing process innovation, SMEs can become more agile and responsive to market demands and achieve higher levels of productivity and profitability. (For further reading on process innovation or improvement – click here)

One approach to process innovation is to leverage digital technologies such as artificial intelligence, machine learning, or the internet of things (IoT) to automate processes and enhance decision-making. This can involve implementing smart sensors and devices that can collect and analyse data in real-time, enabling SMEs to optimise their processes and identify opportunities for improvement. (For further information about Digital Technologies check-out 7 Digital Technologies that will Transform Your Factory)

Another approach is to adopt lean manufacturing principles, which refers to eliminating waste from the production process. One way to do this is through continuous improvement programs like Six Sigma or Kaizen. These programs enable you to systematically identify areas for improvement and implement changes.

Business Model Innovation

Business model innovation involves developing new revenue streams or business models that can drive growth and increase profitability. This can involve exploring new markets, developing new distribution channels, or offering new value-added services.

One approach to business model innovation is to develop a subscription-based service that offers customers ongoing value and generates recurring revenue for SMEs. This can involve offering a service that complements existing products or developing a new product that is sold on a subscription basis.

Another approach is to explore online marketplaces or e-commerce platforms to reach new customers and expand the SME’s reach. SMEs can also leverage social media and other digital marketing channels to build brand awareness and generate leads.

Collaborative Innovation

Collaborative innovation involves partnering with other companies, universities, or research institutions to access new ideas, technologies, and resources. This can help SMEs develop breakthrough products or processes that would be difficult to achieve on their own.

One approach to collaborative innovation is to engage in open innovation, which involves collaborating with external partners and crowdsourcing ideas. This can involve setting up innovation challenges or hackathons to encourage the development of new ideas or products.

Another approach is to develop strategic partnerships with other companies or research institutions to access new knowledge or resources. This can involve forming joint ventures or licensing agreements to share expertise and resources.

Open Innovation

Open innovation involves collaborating with external partners and crowdsourcing ideas to accelerate innovation efforts. This can involve engaging with customers, suppliers, or other stakeholders to tap into a broader pool of knowledge and expertise.

One approach to open innovation is to engage in co-creation, which involves collaborating with customers to develop new products or services. This can involve setting up user communities or customer advisory boards to gather feedback and insights.

Another approach is to leverage open innovation platforms or networks to access a wider pool of ideas and resources. SMEs can also participate in industry events or conferences to network with other professionals and share best practices for innovation.

In order to successfully implement open innovation, SMEs should create a culture that values and encourages innovation. This can involve setting up an innovation team or department, providing training and resources for employees to develop their innovation skills, and incentivising and rewarding innovation efforts.

Conclusion

In conclusion, innovation is a critical driver of growth for SME manufacturing businesses in the UK. By adopting an innovation mindset, SMEs can stay ahead of the competition, create more value for their customers, and achieve long-term success. Whether through product innovation, process innovation, business model innovation, collaborative innovation, or open innovation, SMEs have many options to explore and unlock their full potential.

Leveraging Growth Mindset and Fact-Based Management in Manufacturing

The difference between stagnation and growth often lies in mindset and management approach. The case of an SME Manufacturer with an £8m turnover, which lost a monumental £1.5 million order to a competitor that did not even manufacture but merely outsourced, illustrates a vital lesson in resilience, mindset, and strategic focus.

The Importance of Managing by Facts

Today’s manufacturing landscape demands a shift from traditional, often emotionally-driven decision-making to a more robust, evidence-based approach known as ‘managing by fact.’ This paradigm underscores the necessity of grounding decisions in data, metrics, and factual evidence rather than intuition, gut feelings, or emotions. It’s a shift that aims to heighten efficiency, enhance productivity, and foster innovation by making informed decisions that are aligned with strategic objectives and market demands.

Understanding ‘Manage by Fact’

‘Manage by Fact’ is not just a catchphrase; it’s a comprehensive approach that encompasses:

  • Data-Driven Decision Making: Leveraging real-time data and analytics to guide strategic decisions, leading to more targeted and effective outcomes.
  • Performance Metrics: Establishing clear, measurable objectives that help in assessing performance against goals, thereby facilitating continuous improvement.
  • Objective Analysis: Encouraging a culture where decisions are made based on objective analysis rather than subjective opinion or hierarchical pressures.
growth mindset

The Power of a Growth Mindset

At the heart of the SME Manufacturer’s story is the concept of a ‘growth mindset,’ a term coined by psychologist Carol Dweck. It denotes an underlying belief that talents can be developed through hard work, effective strategies, and input from others as opposed to a ‘fixed mindset’ which posits that talents and abilities are static and unchangeable.

A growth mindset in manufacturing signifies:

  • Embracing Challenges: Seeing failures, like losing a significant order, as opportunities to learn and evolve instead of insurmountable setbacks.
  • Persistent Effort: Understanding that mastery and improvement require time, effort, and perseverance.
  • Feedback and Critique: Welcoming constructive criticism as a resource for learning and development.
  • Learning from the Success of Others: Viewing peers and competitors as sources of knowledge and inspiration rather than threats.

Combining Fact-Based Management with a Growth Mindset

The synergy between managing by fact and fostering a growth mindset can become a formidable strategy in manufacturing. Here’s how:

  1. Data-Driven Insights for Continuous Learning: Utilising data not just for operational decisions but for learning and development, aligning employee growth with strategic business goals.
  2. Metrics for Performance and Growth: Performance metrics and KPIs can serve dual purposes—measuring current productivity and efficiency while identifying areas for skill development and innovation.
  3. Adaptability through Objective Analysis: An objective, fact-based approach empowers teams to adapt swiftly to market changes, technological advancements, and competitive dynamics, fostering a culture of continuous improvement and agility.

The Story of Resilience and Adaptation

Returning to the narrative of the SME Manufacturer, the loss of a £1.5 million order could have been a crippling blow. However, the management and team’s growth mindset, coupled with a strategic focus on facts and data, turned a potential disaster into a learning opportunity. It pushed the company to analyse what went wrong, to understand the market and competitors better, and to refine its value proposition and operations accordingly.

Their journey underscores several key takeaways for manufacturers:

  • Resilience is Key: The ability to bounce back from setbacks, powered by a belief in continuous improvement and the possibility of growth.
  • Embrace Change: Being open to change and willing to adapt strategies based on what the data shows can differentiate between stagnation and growth.
  • Collaborative Teamwork: A shared growth mindset within the team fosters collaboration, innovation, and shared ownership of both challenges and successes.

Conclusion: Forging Ahead with Facts and Growth

As the manufacturing sector continues to evolve amidst ever-changing market dynamics, the story of the SME Manufacturer serves as a compelling case study in the power of managing by facts not by emotion, and the transformative impact of a growth mindset.

Their experience illuminates a path forward for manufacturers seeking to navigate the complexities of modern-day business. It’s a dual approach where decisions are driven by data and insights, and where challenges and setbacks are seen not as endpoints but as stepping stones to greater achievements.

The manufacturers who will thrive are those who embrace the power of data, leverage the resilience of a growth mindset, and view every challenge as a new opportunity for growth and learning. Just as the SME Manufacturer demonstrated, the key lies in not just focusing on what to shrink but rather on what to grow. By striving to be better today than yesterday and planning to be better tomorrow than today, manufacturing businesses can ensure they remain competitive, innovative, and poised for success in an ever-evolving landscape.

0330 311 2820

Miss that moment – and you start to decline.

“There is at least one point in the history of any company when you have to change dramatically to rise to the next level of performance. Miss that moment – and you start to decline.” – Andy Gove

My personal view and experience is that it’s more than one point in time.

SMEs are characterised by their ability to adapt easily to market changes and their lean organisational structure (not as in Lean Manufacturing), which results in a more dynamic environment and a quicker decision making process. Although SME businesses vary widely in size and capacity for growth generally they will all follow a similar path: going from Owner/Entrepreneur with two or three employees to a business aiming for £10m or even £20m per year, and experiencing 20%/30% year on year growth and upwards along this journey. The sketch below illustrates an example of this, showing where most businesses may feel the pinch points of growth at key intersections.

SME Journey and Growth

Zero to £5m

The hard work really kicks in here. This part of the journey is often the one that is the most lonely, but often the most exciting. But it is here that most business owners feel the pains. Because it can be a lonely place, it is easy for owners to doubt themselves, they also don’t know what they don’t know which can be a limiting factor. And as an owner one of the main areas of responsibility is simply getting things done, which means you are working in your business as a manufacturer, and not working on it as a strategic leader.

In smaller SMES, management structures are also small with most owners being very hands-on. People are stretched across all functions all processes. Systems are not in place, IT is minimal or non-existent and there is a lack of standard processes. Utilising the Continuous Improvement and Management graph we can see that all levels are being worked with a very lean structure. Small customer projects, odd-job shop style of working.

SME Zero to £5m

As we get closer to a turnover of £5m, it becomes clear that things need to change. We are then moving from that odd-job, one off customer delivery to a mix of bigger projects, possible increased volumes and an increase in market share from your customers. As we start to scale-up from the initial start-up, decisions have to be made about the organisational structure, the company’s technology infrastructure, its business and marketing strategy, etc. With regard to organisational structure, you might now start to see the requirement for supervisory position(s) to take on more of the owners duties, the labour force growing, new machines, loans, investment, functional departments, Operations, Quality, Sales, Technical, Finance. This is where it can be rise or decline with those decisions. In scaling and growth and the opportunities it also brings its own set of problems, (albeit they are nice problems to have because its growth).

£5m to £10m

IT Systems and Planning may start to become an issue here, Microsoft Excel may no longer be good enough to manage your shop floor requirements (although I have seen £100m business still using excel but it was beginning to creak), and you are likely at this level to be considering MRP/ERP implementations. You may also look at outsourcing some functions, like Sales, Human Resources, Engineering Support, Quality, Quality Accreditation. All this requires a lot of investment in terms of time, money and energy. You need to do your homework to avoid costly mistakes, especially where IT is concerned, but it’s all opportunity.

And this stage, the business owner is now becoming more removed from the day to day operational tasks on the shop floor. This can be a very uncomfortable feeling in one or two ways. Firstly, the owner may want that hands-on role and not relinquish that part. It could be that the business is now at the stage where the owner is stopping it from growing, the entrepreneurial side is restricted as they are tied to the business. There a number of factors and variables in play, and having the right people is key, being a good leader is fundamental (at all stages).

SME £5m to £10m

£10m upwards

Financial Audits are required at this point (although some companies can be exempt if they satisfy certain criteria), so businesses need to be aware of the UK Audit requirements. Similar issues and opportunities still arise, but on a grander scale. Organisational structures are still fundamental, we might now start to see the need for Middle Management. We may also be looking to diversify into new markets, take on bigger orders, and higher volume. From £5m and up, some of your customers may not be the ones you want to deal with now, the one-off, low volume, job shop may not be your ideal customer. You might be seeing more of a need for Product Flow and Cells (Lean Manufacturing is a must from when you first start up), competition is high so you cannot stand still, even if your decision is to stay at a certain level. You will need to be driving for improvements to maintain the status quo, and your service has to be exceptional. Collaboration with a network of Manufacturers and or Partners, in my opinion, is key in this new world, and can bring some fantastic opportunities for growth. Again, IT infrastructure comes into play as the business is getting bigger: more employees, management leadership. The addition of new premises or additional buildings on the same industrial estate (this is where having a world class logistics operations pays dividends in not impacting your efficiency/productivity). The opportunities may now open up bringing the out-sourced services back in house, Sales and Human Resources, etc. At this level, you are likely to be making informed decisions based around data. Strategy alignment throughout the organisation is required, communicated and disseminated so everyone in the organisation knows the direction the company is going in and what the priorities are.

SME £10m upwards

Every business is different. One business’s pinch point may be at £3.5m another’s £7.5m but there will be very similar decisions to be made, but at this level the advantage is that businesses are likely to be able to make these decisions in a more informed way through data. Companies may not achieve sustained profitable growth unless they draft in the specialist skills required at the right time for the business. It’s the maxim that we don’t know what we don’t know. And the best advice is to seek advice from the experts in order to shift the dial in the right direction. This is something we can certainly help with, just contact the number below.

Ask yourself:

How much will it cost you not to resolve the issues that you are currently facing now or in the immediate future? How much will it cost you not to eliminate that pain? What are the lost opportunities on not taking your business to the next level or indeed keeping it at the level you want?

0330 311 2820

Book a Return Call at a time that Best Suits You “HERE

Attention! – your Customers could be gone in 60 secs or less

Sales and Marketing

None of this is new and you probably heard it all before, but in my eyes that’s why it’s so important.

Sales and Marketing go hand in hand within any business, and every leader/owner should be working on their business (not in it) for a few hours a day.

But what do I mean working on your business.

Most businesses want to grow, so, you will have stated somewhere “I’m going to get from here to there by then”, now as an example this may be “Sales from £1m to £1.25m by end of 2018”.

So the working on your business (couple of hours/day), is all about the things you are going to do to get there. Now, you may have sales people, teams, etc.. this does not excuse you or absolve you of all responsibility in how, what, when, where, who and why in getting to that £1.25m.

Getting and Keeping Customers

This about your existing customers, new customers, finding new customers. (and attention is key, at 60 secs half your audience will have gone)

Examples may be:

  • Email campaigns, content, using the AIDA formula. (Attention, Interest, Desire, Action)
  • Sniper Marketing
  • New Products and Services
  • Reviewing your Social Media Impact (Google Adwords, facebook, twitter)

And don’t not underestimate the power of social media all because you are manufacturers, first port of call is having a website that is optimised and use friendly, something I’m currently sorting.

Sales Stats and Tips:

  • Over 60% of traffic is through mobile (phone/tablet). So, ensure optimised Mobile view first.
  • Over 50% of email is managed from mobile. Again, optimise for mobile viewing
  • At 60 secs half your audience will have gone (Attention is single most important word in marketing)
  • Your website load speed matters, big impact on ranking with Google.
  • Optimise your Linkedin profile, it’s not a CV, tell them where you add value.
  • 50 million Small Business on Facebook, 1.86bn active users, 66% log on every day. Search options are superb, but only 49% will support a brand liking, so how do we get in front of the others?
  • 56% of people would rather chat online than phone, you can now add chat boxes, Facebook messenger button, and more.
  • 67% will interact online with businesses.

But above all

DON’T FORGET TO ANSWER THE PHONE OR MAKE A CALL! (again remember attention, don’t answer in more than 5 rings and they’re probably gone.)

PS: It’s not the responsibility of your customers to keep you in mind, it’s your responsibility to keep you in their mind.

0330 311 2820

Book a Return Call at a time that Best Suits You “HERE

Understanding your Competitive Performance

Understanding your Competitive Performance can be used as a differentiator as well as a enabler for growth.

Analysing where our business sits compared with our competitors (order losing, parity, advantage, superior) across the six categories of Quality, Cost, Delivery, Agility, Tech & Innovation and Customer Experience is an excellent way of highlighting where you need to focus.

Competitive Performance Analysis

If you’re sure your competitors are doing something better than you, you need to respond and make some changes. It could be anything from improving customer service, assessing your prices and updating your products, to driving process capability and performance.

Exploit the gaps you’ve identified. These may be in your product range or service, marketing or distribution, even the way you recruit and retain employees.

Customer Experience reputation can often provide the difference between businesses that operate in a very competitive market. Renew your efforts in these areas to exploit the deficiencies you’ve discovered, listen to the Voice of the Customer.

But don’t be complacent about your current strengths. Your current offerings may still need improving and your competitors may also be assessing you. They may adopt and enhance your good ideas.

Don’t stand still!

0330 311 2820

Book a Return Call at a time that Best Suits You “HERE

We’re different it won’t work here

It’s been an interesting month, great meetings, new contacts and one of the most interesting presentations I‘ve given regarding Operational Excellence and Problem Solving.

The presentation was given to the Manufacturing and Construction sectors as part of a Seminar/Workshop.

The comments at the end we’re ones I have heard over and over again, “We’re Different, it won’t work here!

Is “we’re different” an excuse not try to improve?

This got me thinking in one of my reflective moments, what is it that naturally creates this push back? Do we think that Business Excellence, Operational Excellence, Lean or Six Sigma is a technical tool and technique, only applied to manufacturing, high volume processes, etc? Is it we naturally assume that it’s for the automotive industry?

There are a number of answers you can come up with that can be assigned to this emotion and push back.

So we have to ask ourselves

Do business improvement principles (as that is all they are) apply to pretty much every process? Yes, I’d say so. Does that mean its easy to put in place? Absolutely not. But that, along with being different, should be no reason to not try.

Which leads me on from last month’s article REFLECTION! and into OPERATIONAL EXCELLENCE TRANSFORMATION

We must first seek to understand what is it we are trying to solve, what problem? This could be as an organisation, function, sub-process.

Then we must ask,

What process improvement needs to be done? What do I need to design, re-design, improve to solve our problem and achieve our objective?

Next,

Do I have the capability in house? Do I have the skillset within my team?

We then come to,

What mindset do I need to have? Growth? (One of learning as we do not have the capability in house), Implementation (I have the capability so execute, or get support if you don’t), Experimental (try and test)

Remembering that Leadership behaviour and Programme Management are the key. The governance process you apply.

Final thought – it’s often said that “Operational Excellence doesn’t succeed or fail… it’s just a set of principles. What succeeds or fails is the organisation or the leaders who try.” Success isn’t guaranteed — it requires hard work and creativity to figure out how will work in your setting, because you are different!

0330 311 2820

Book a Return Call at a time that Best Suits You “HERE

Manufacturing Websites, to web or not to web?

Recently I started a discussion regarding SMEs and their websites, the discussion started with this quote “an interesting observation this week whilst working, how many SMEs lack an all singing all dancing website. What’s the reason, with 90+% of people now looking on line this should be a priority.” Now all singing all dancing to me means bringing a Return on Investment. Here some excellent extracts and comments from the people involved, I’ve tried to get a balance within the discussion, and this is not my area of expertise.

Ashley Pearce: “In research I conducted recently an overwhelming number of those involved with Business Development in the UK Manufacturing Sector didn’t understand the actual function of a website.
Where does it fit in? Is it just a standalone item? Is it our “Digital shopfront“? Is it relevant in our industry?
These were common questions that we arrived at after a short discussion with most. It’s what inspired a number of articles explaining the “System of Modern Sales & Marketing” over on the Manufacturing Network UK Blog.
Fundamentally a Website is often NOT, but SHOULD be seen as, “Part of a System” for attracting, nurturing and converting leads into customers. Can you see the many ways your website & web presence CAN contribute to the system?”

Ashley Pearce: “For me, the most effective way to explain how a website “Fits in” has been to direct them towards the subject of “Inbound Marketing” – with FAIR WARNING. As we say over on the Manufacturing Network Blog almost weekly, “Wear Your Manufacturing Industry Blinkers” when reading anything about marketing your business online.

Most of the information, content and articles out there explaining how it works is NOT written for you, the UK Manufacturer. I think this is why an Integrated approach to Online Marketing and Offline Sales for UK Manufacturing has been very slow to evolve. Lack of “Context” – Explained in the UK Manufacturing Industry context, we may start to see some savvy marketers leaping ahead of the competition”

Garry Taylor: “There is a feeling that unless you can get on the first 2 pages of Google there’s no Point having a Web page. as we don’t actually do sales transactions over the Internet we view as an online brochure with the blog giving any up to date info and an opportunity for feedback plus, small companies are being pushed to pay per click. Everyone knows most people clicking on your sight are not buying so you pay for nothing.”

Richard Stinson: “I spent many years in the engineering sector, from toolmaker to technical sales and I had the privilege of working directly and indirectly with many SME’s as well as the giants like Rolls and BAE. I came to realise quite quickly that the big boys have regular web trawls looking for potential suppliers, just in case their current suppliers let them down or become swamped with work. They literally have a file of reserve suppliers on their list found online. The moral of this story is that unless the SME’s had an effective web presence they were overlooked for many of these lucrative contracts.”

Alan Kent: “Whilst I can appreciate that having a web site might bring you some business, not having one will definitely bring you none. I do feel that it is becoming a bit BS5750-ish though as having a fancy web site costs money that many SMEs would rather channel into capital equipment or a decent salesman who will definitely generate revenues. I can recall putting in a lot of effort into attaining BS5750 in the 1990s which cost a lot of time and money and brought in no sales leads whatsoever. At the time no-one had realised that it was simply a way of showing that you had a process and was never expected to generate leads but without it, you would definitely get no leads.”

Chris Davis: “There are loads of things you can do here. Small web site intelligently constructed .. put stuff on eBay and Amazon have a blog use social media .. Wiki presence .. the list goes on but none of these are difficult or really expensive. It’s not an option to not have a cyber presence?”

Jeremy Wisner: “The topic concerns the need for an ‘All singing/dancing’ website. For many SMEs, operating in specialist niches, it is questionable about the return on such a site. Absolutely, a solid and informative web presence is a must (largely for contact information and credibility). However, it is in the nature of many niche-SMEs that they will know who their potential customers are and will be cultivating B2B relationships via more direct approaches, rather than hoping to WOW website visitors. Niche products and services, by nature, often require specialised knowledge to explain to USP to potential buyers. Of course, retail is a whole different discussion.
90%+ will look online, yes. However, I’d argue that for the niche players, the hard yards have already been covered by the ‘song and dance’ created offline – backed up by effective SEO work – which again strengthens credibility.”

Adam Payne: “Disagree with you Jeremy, when I look at the SMEs including two that we were looking to acquire in a niche market, had limited website presence and no sales and marketing function, relying on word of mouth and guess how they were performing. If you are looking to expand your business you need an online presence, again as an example, recently I was supporting a company to try and source stretch forming, the search was not easy due to again lack of online presence and SEO setup, I ‘m sure to god there are businesses in the UK, but they missed a big opportunity. Now this is not my area, but if you are happy as a business then you stay as you are, but rest assured someone will be around the corner waiting to pounce if you are not bringing in customers, if you are looking to expand you need multiple marketing pillars and a top website is one of those with an inbound marketing approach (blog showing expertise, contact form with call to action, etc).”

Ashley Pearce: “This discussion thread has done a great deal in exposing the core beliefs that sit behind the reason / purpose / ultimate aim behind a website for a B2B Sales focused business.

The purpose of a website for B2C or retail is completely different. The website can have more to do with sales and sales fulfillment than it can with building the confidence of a prospect and developing a relationship.

Just because they look the same on the outside and are accessed via a web browser does not mean they are the “same thing”.

Fact 1: You are not going to receive sales through your company website in the manufacturing industry. You’re not selling products, you’re selling capability.

Fact 2: Buyers do their searching a researching online before EVER reaching out and asking for information, requesting a quote or expressing interest.

Lesson: If your website doesn’t start a conversation with the Buyers and Engineers visiting it, you will be overlooked…”

0330 311 2820

Book a Return Call at a time that Best Suits You “HERE”

Managing the Product Lifecycle: Forward Planning for Business Longevity

What is the product lifecycle?

Many of us have heard of the Boston Matrix, “cash cows” “rising stars” and so on, however whilst we understand the principle do not build it in to our day to day business. Managing the product lifecycle and using your understanding of this to ensure the longevity of your business is critical to long term success.

For each of our products and services, we should have a thorough understanding of where they are in their product life cycle, is the market for them still growing and developing, is it at its peak or is it already in its downward spiral? We should also have an understanding of what this means for the future of our business, if the product or service which we rely on to make the majority of the profits in our business is on a downward trajectory, that spells trouble and we should be focusing our efforts on other areas of our portfolio and product development.

Determining your place in the product lifecycle

Here are 3 questions you can use for assessing your products and services using the product lifecycle;

What pattern are you seeing in your sales? Are they rising, stagnant or falling?

What are your profit margins doing? Are they rising, stagnant or falling?

How profitable are you products and services? Which ones make you the most money?

Use the answers to these three questions to prioritise your product/services when you are allocating resources. By resources I mean time as well as money. If you have a product or service which is extremely profitable and has a growing market, this is where you should be spending your time, not on one of your older, potentially “classic” products which no longer has a stable market. This may seem like common sense but it can be incredible hard to be that brutally honest with yourself and your business and let go of the products or services that you are emotionally invested in. Use the numbers and the patterns to drive your behaviour, and be brutal about it! If you need help our Business Accelerator Programme might be of interest.

0330 311 2820

Book a Return Call at a time that Best Suits You “HERE